Cerca negli script per "MA Cross"

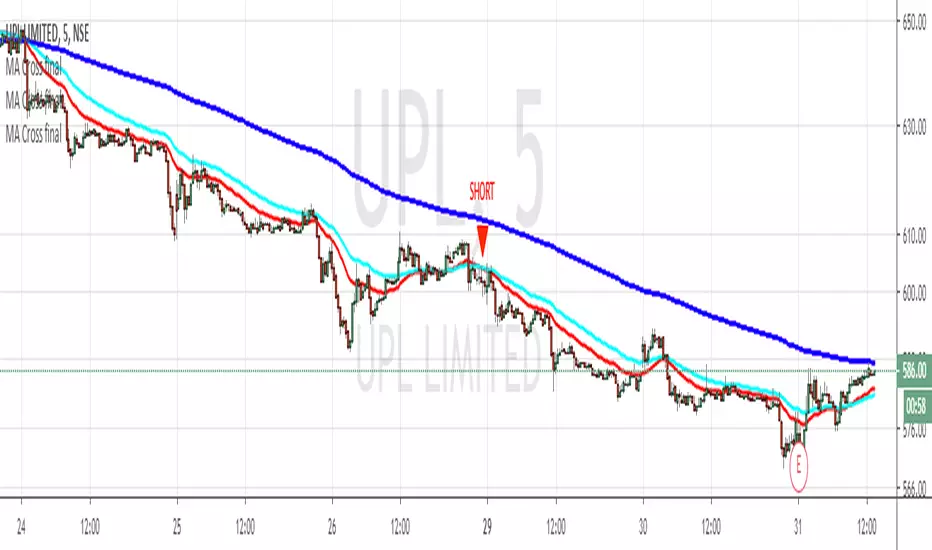
MA Cross 9 & 30 trend analysisvery good fro a simple trend analysis. 9 and 30 did work for me and I want to share.


MA RSI MACD Signal SuiteThis Pine Script™ is designed for use in Trading View and generates trading signals based on moving average (MA) crossovers, RSI (Relative Strength Index) signals, and MACD (Moving Average Convergence Divergence) indicators. It provides visual markers on the chart and can be configured to suit various trading strategies.
1. Indicator Overview
The indicator includes signals for:
Moving Averages (MA): It tracks crossovers between different types of moving averages.
RSI: Signals based on RSI crossing certain levels or its signal line.
MACD: Buy and sell signals generated by MACD crossovers.
2. Inputs and Customization
Moving Averages (MAs):
You can customize up to 6 moving averages with different types, lengths, and colors.
MA Type: Choose from different types of moving averages:
SMA (Simple Moving Average)
EMA (Exponential Moving Average)
HMA (Hull Moving Average)
SMMA (RMA) (Smoothed Moving Average)
WMA (Weighted Moving Average)
VWMA (Volume Weighted Moving Average)
T3, DEMA, TEMA
Source: Select the price to base the MA on (e.g., close, open, high, low).
Length: Define the number of periods for each moving average.
Examples:
MA1: Exponential Moving Average (EMA) with a period of 9
MA2: Exponential Moving Average (EMA) with a period of 21
RSI Settings:
RSI is calculated based on a user-defined period and is used to identify potential overbought or oversold conditions.
RSI Length: Lookback period for RSI (default 14).
Overbought Level: Defines the overbought threshold for RSI (default 70).
Oversold Level: Defines the oversold threshold for RSI (default 30).
You can also adjust the smoothing for the RSI signal line and customize when to trigger buy and sell signals based on the RSI crossing these levels.
MACD Settings:
MACD is used for identifying changes in momentum and trends.
Fast Length: The period for the fast moving average (default 12).
Slow Length: The period for the slow moving average (default 26).
Signal Length: The period for the signal line (default 9).
Smoothing Method: Choose between SMA or EMA for both the MACD and the signal line.
3. Signal Logic
Moving Average (MA) Crossover Signals:
Crossover: A bullish signal is generated when a fast MA crosses above a slow MA.
Crossunder: A bearish signal is generated when a fast MA crosses below a slow MA.
The crossovers are plotted with distinct colors, and the chart will display markers for these crossover events.
RSI Signals:
Oversold Crossover: A bullish signal when RSI crosses over its signal line below the oversold level (30).
Overbought Crossunder: A bearish signal when RSI crosses under its signal line above the overbought level (70).
RSI signals are divided into:
Aggressive (Early) Entries: Signals when RSI is crossing the oversold/overbought levels.
Conservative Entries: Signals when RSI confirms a reversal after crossing these levels.
MACD Signals:
Buy Signal: Generated when the MACD line crosses above the signal line (bullish crossover).
Sell Signal: Generated when the MACD line crosses below the signal line (bearish crossunder).
Additionally, the MACD histogram is used to identify momentum shifts:
Rising to Falling Histogram: Alerts when the MACD histogram switches from rising to falling.
Falling to Rising Histogram: Alerts when the MACD histogram switches from falling to rising.
4. Visuals and Alerts
Plotting:
The script plots the following on the price chart:
Moving Averages (MA): The selected MAs are plotted as lines.
Buy/Sell Shapes: Triangular markers are displayed for buy and sell signals generated by RSI and MACD.
Crossover and Crossunder Markers: Crosses are shown when two MAs crossover or crossunder.
Alerts:
Alerts can be configured based on the following conditions:
RSI Signals: Alerts for oversold or overbought crossover and crossunder events.
MACD Signals: Alerts for MACD line crossovers or momentum shifts in the MACD histogram.
Alerts are triggered when specific conditions are met, such as:
RSI crosses over or under the oversold/overbought levels.
MACD crosses the signal line.
Changes in the MACD histogram.
5. Example Usage
1. Trend Reversal Setup:
Buy Signal: Use the RSI oversold crossover and MACD bullish crossover to identify potential entry points in a downtrend.
Sell Signal: Use the RSI overbought crossunder and MACD bearish crossunder to identify potential exit points or short entries in an uptrend.
2. Momentum Strategy:
Combine MACD and RSI signals to identify the strength of a trend. Use MACD histogram analysis and RSI levels for confirmation.
3. Moving Average Crossover Strategy:
Focus on specific MA crossovers, such as the 9-period EMA crossing above the 21-period EMA, for buy signals. When a longer-term MA (e.g., 50-period) crosses a shorter-term MA, it may indicate a strong trend change.
6. Alerts Conditions
The script includes several alert conditions, which can be triggered and customized based on the user’s preferences:
RSI Oversold Crossover: Alerts when RSI crosses over the signal line below the oversold level (30).
RSI Overbought Crossunder: Alerts when RSI crosses under the signal line above the overbought level (70).
MACD Buy/Sell Crossover: Alerts when the MACD line crosses the signal line for a buy or sell signal.
7. Conclusion
This script is highly customizable and can be adjusted to suit different trading strategies. By combining MAs, RSI, and MACD, traders can gain multiple perspectives on the market, enhancing their ability to identify potential buy and sell opportunities.

Ultimate MACD [captainua]Ultimate MACD - Comprehensive MACD Trading System
Overview
This indicator combines traditional MACD calculations with advanced features including divergence detection, volume analysis, histogram analysis tools, regression forecasting, strong top/bottom detection, and multi-timeframe confirmation to provide a comprehensive MACD-based trading system. The script calculates MACD using configurable moving average types (EMA, SMA, RMA, WMA) and applies various smoothing methods to reduce noise while maintaining responsiveness. The combination of these features creates a multi-layered confirmation system that reduces false signals by requiring alignment across multiple indicators and timeframes.
Core Calculations
MACD Calculation:
The script calculates MACD using the standard formula: MACD Line = Fast MA - Slow MA, Signal Line = Moving Average of MACD Line, Histogram = MACD Line - Signal Line. The default parameters are Fast=12, Slow=26, Signal=9, matching the traditional MACD settings. The script supports four moving average types:
- EMA (Exponential Moving Average): Standard and most responsive, default choice
- SMA (Simple Moving Average): Equal weight to all periods
- RMA (Wilder's Moving Average): Smoother, less responsive
- WMA (Weighted Moving Average): Recent prices weighted more heavily
The price source can be configured as Close (standard), Open, High, Low, HL2, HLC3, or OHLC4. Alternative sources provide different sensitivity characteristics for various trading strategies.
Configuration Presets:
The script includes trading style presets that automatically configure MACD parameters:
- Scalping: Fast/Responsive settings (8,18,6 with minimal smoothing)
- Day Trading: Balanced settings (10,22,7 with minimal smoothing)
- Swing Trading: Standard settings (12,26,9 with moderate smoothing)
- Position Trading: Smooth/Conservative settings (15,35,12 with higher smoothing)
- Custom: Full manual control over all parameters
Histogram Smoothing:
The histogram can be smoothed using EMA to reduce noise and filter minor fluctuations. Smoothing length of 1 = raw histogram (no smoothing), higher values (3-5) = smoother histogram. Increased smoothing reduces noise but may delay signals slightly.
Percentage Mode:
MACD values can be converted to percentage of price (MACD/Close*100) for cross-instrument comparison. This is useful when comparing MACD signals across instruments with different price levels (e.g., BTC vs ETH). The percentage mode normalizes MACD values, making them comparable regardless of instrument price.
MACD Scale Factor:
A scale factor multiplier (default 1.0) allows adjusting MACD display size for better visibility. Use 0.3-0.5 if MACD appears too compressed, or 2.0-3.0 if too small.
Dynamic Overbought/Oversold Levels:
Overbought and oversold levels are calculated dynamically based on MACD's mean and standard deviation over a lookback period. The formula: OB = MACD Mean + (StdDev × OB Multiplier), OS = MACD Mean - (StdDev × OS Multiplier). This adapts to current market conditions, widening in volatile markets and narrowing in calm markets. The lookback period (default 20) controls how quickly the levels adapt: longer periods (30-50) = more stable levels, shorter (10-15) = more responsive.
OB/OS Background Coloring:
Optional background coloring can highlight the entire panel when MACD enters overbought or oversold territory, providing prominent visual indication of extreme conditions. The background colors are drawn on top of the main background to ensure visibility.
Divergence Detection
Regular Divergence:
The script uses the MACD line (not histogram) for divergence detection, which provides more reliable signals. Bullish divergence: Price makes a lower low while MACD line makes a higher low. Bearish divergence: Price makes a higher high while MACD line makes a lower high. Divergences often precede reversals and are powerful reversal signals.
Pivot-Based Divergence:
The divergence detection uses actual pivot points (pivotlow/pivothigh) instead of simple lowest/highest comparisons. This provides more accurate divergence detection by identifying significant pivot lows/highs in both price and MACD line. The pivot-based method compares two recent pivot points: for bullish divergence, price makes a lower low while MACD makes a higher low at the pivot points. This method reduces false divergences by requiring actual pivot points rather than just any low/high within a period.
The pivot lookback parameters (left and right) control how many bars on each side of a pivot are required for confirmation. Higher values = more conservative pivot detection.
Hidden Divergence:
Continuation patterns that signal trend continuation rather than reversal. Bullish hidden divergence: Price makes a higher low but MACD makes a lower low. Bearish hidden divergence: Price makes a lower high but MACD makes a higher high. These patterns indicate the trend is likely to continue in the current direction.
Zero-Line Filter:
The "Don't Touch Zero Line" option ensures divergences occur in proper context: for bullish divergence, MACD must stay below zero; for bearish divergence, MACD must stay above zero. This filters out divergences that occur in neutral zones.
Range Filtering:
Minimum and maximum lookback ranges control the time window between pivots to consider for divergence. This helps filter out divergences that are too close together (noise) or too far apart (less relevant).
Volume Confirmation System
Volume threshold filtering requires current volume to exceed the volume SMA multiplied by the threshold factor. The formula: Volume Confirmed = Volume > (Volume SMA × Threshold). If the threshold is set to 1.0 or lower, volume confirmation is effectively disabled (always returns true). This allows you to use the indicator without volume filtering if desired. Volume confirmation significantly increases divergence and signal reliability.
Volume Climax and Dry-Up Detection:
The script can mark bars with extremely high volume (volume climax) or extremely low volume (volume dry-up). Volume climax indicates potential reversal points or strong momentum continuation. Volume dry-up indicates low participation and may produce unreliable signals. These markers use standard deviation multipliers to identify extreme volume conditions.
Zero-Line Cross Detection
MACD zero-line crosses indicate momentum shifts: above zero = bullish momentum, below zero = bearish momentum. The script includes alert conditions for zero-line crosses with cooldown protection to prevent alert spam. Zero-line crosses can provide early warning signals before MACD crosses the signal line.
Histogram Analysis Tools
Histogram Moving Average:
A moving average applied to the histogram itself helps identify histogram trend direction and acts as a signal line for histogram movements. Supports EMA, SMA, RMA, and WMA types. Useful for identifying when histogram momentum is strengthening or weakening.
Histogram Bollinger Bands:
Bollinger Bands are applied to the MACD histogram instead of price. The calculation: Basis = SMA(Histogram, Period), StdDev = stdev(Histogram, Period), Upper = Basis + (StdDev × Deviation Multiplier), Lower = Basis - (StdDev × Deviation Multiplier). This creates dynamic zones around the histogram that adapt to histogram volatility. When the histogram touches or exceeds the bands, it indicates extreme conditions relative to recent histogram behavior.
Stochastic MACD (StochMACD):
Stochastic MACD applies the Stochastic oscillator formula to the MACD histogram instead of price. This normalizes the histogram to a 0-100 scale, making it easier to identify overbought/oversold conditions on the histogram itself. The calculation: %K = ((Histogram - Lowest Histogram) / (Highest Histogram - Lowest Histogram)) × 100. %K is smoothed, and %D is calculated as the moving average of smoothed %K. Standard thresholds are 80 (overbought) and 20 (oversold).
Regression Forecasting
The script includes advanced regression forecasting that predicts future MACD values using mathematical models. This helps anticipate potential MACD movements and provides forward-looking context for trading decisions.
Regression Types:
- Linear: Simple trend line (y = mx + b) - fastest, works well for steady trends
- Polynomial: Quadratic curve (y = ax² + bx + c) - captures curvature in MACD movement
- Exponential Smoothing: Weighted average with more weight on recent values - responsive to recent changes
- Moving Average: Uses difference between short and long MA to estimate trend - stable and smooth
Forecast Horizon:
Number of bars to forecast ahead (default 5, max 50 for linear/MA, max 20 for polynomial due to performance). Longer horizons predict further ahead but may be less accurate.
Confidence Bands:
Optional upper/lower bands around forecast show prediction uncertainty based on forecast error (standard deviation of prediction vs actual). Wider bands = higher uncertainty. The confidence level multiplier (default 1.5) controls band width.
Forecast Display:
Forecast appears as dotted lines extending forward from current bar, with optional confidence bands. All forecast values respect percentage mode and scale factor settings.
Strong Top/Bottom Signals
The script detects strong recovery from extreme MACD levels, generating "sBottom" and "sTop" signals. These identify significant reversal potential when MACD recovers substantially from overbought/oversold extremes.
Strong Bottom (sBottom):
Triggered when:
1. MACD was at or near its lowest point in the bottom period (default 10 bars)
2. MACD was in or near the oversold zone
3. MACD has recovered by at least the threshold amount (default 0.5) from the lowest point
4. Recovery persists for confirmation bars (default 2 consecutive bars)
5. MACD has moved out of the oversold zone
6. Volume is above average
7. All enabled filters pass
8. Minimum bars have passed since last signal (reset period, default 5 bars)
Strong Top (sTop):
Triggered when:
1. MACD was at or near its highest point in the top period (default 7 bars)
2. MACD was in or near the overbought zone
3. MACD has declined by at least the threshold amount (default 0.5) from the highest point
4. Decline persists for confirmation bars (default 2 consecutive bars)
5. MACD has moved out of the overbought zone
6. Volume is above average
7. All enabled filters pass
8. Minimum bars have passed since last signal (reset period, default 5 bars)
Label Placement:
sTop/sBottom labels appear on the historical bar where the actual extreme occurred (not on current bar), showing the exact MACD value at that extreme. Labels respect the unified distance checking system to prevent overlaps with Buy/Sell Strength labels.
Signal Strength Calculation
The script calculates a composite signal strength score (0-100) based on multiple factors:
- MACD distance from signal line (0-50 points): Larger separation indicates stronger signal
- Volume confirmation (0-15 points): Volume above average adds points
- Secondary timeframe alignment (0-15 points): Higher timeframe agreement adds points
- Distance from zero line (0-20 points): Closer to zero can indicate stronger reversal potential
Higher scores (70+) indicate stronger, more reliable signals. The signal strength is displayed in the statistics table and can be used as a filter to only accept signals above a threshold.
Smart Label Placement System
The script includes an advanced label placement system that tracks MACD extremes and places Buy/Sell Strength labels at optimal locations:
Label Placement Algorithm:
- Labels appear on the current bar at confirmation (not on historical extreme bars), ensuring they're visible when the signal is confirmed
- The system tracks pending signals when MACD enters OB/OS zones or crosses the signal line
- During tracking, the system continuously searches for the true extreme (lowest MACD for buys, highest MACD for sells) within a configurable historical lookback period
- Labels are only finalized when: (1) MACD exits the OB/OS zone, (2) sufficient bars have passed (2x minimum distance), (3) MACD has recovered/declined by a configurable percentage from the extreme (default 15%), and (4) tracking has stopped (no better extreme found)
Label Spacing and Overlap Prevention:
- Minimum Bars Between Labels: Base distance requirement (default 5 bars)
- Label Spacing Multiplier: Scales the base distance (default 1.5x) for better distribution. Higher values = more spacing between labels
- Effective distance = Base Distance × Spacing Multiplier (e.g., 5 × 1.5 = 7.5 bars minimum)
- Unified distance checking prevents overlaps between all label types (Buy Strength, Sell Strength, sTop, sBottom)
Strength-Based Filtering:
- Label Strength Minimum (%): Only labels with strength at or above this threshold are displayed (default 75%)
- When multiple potential labels are close together, the system automatically compares strengths and keeps only the strongest one
- This ensures only the most significant signals are displayed, reducing chart clutter
Zero Line Polarity Enforcement:
- Enforce Zero Line Polarity (default enabled): Ensures labels follow traditional MACD interpretation
- Buy Strength labels only appear when the tracked extreme MACD value was below zero (negative territory)
- Sell Strength labels only appear when the tracked extreme MACD value was above zero (positive territory)
- This prevents counter-intuitive labels (e.g., Buy labels above zero line) and aligns with standard MACD trading principles
Recovery/Decline Confirmation:
- Recovery/Decline Confirm (%): Percent move away from the extreme required before finalizing (default 15%)
- For Buy labels: MACD must recover by at least this percentage from the tracked bottom
- For Sell labels: MACD must decline by at least this percentage from the tracked top
- Higher values = more confirmation required, fewer but more reliable labels
Historical Lookback:
- Historical Lookback for Label Placement: Number of bars to search for true extremes (default 20)
- The system searches within this period to find the actual lowest/highest MACD value
- Higher values analyze more history but may be slower; lower values are faster but may miss some extremes
Cross Quality Score
The script calculates a MACD cross quality score (0-100) that rates crossover quality based on:
- Cross angle (0-50 points): Steeper crosses = stronger signals
- Volume confirmation (0-25 points): Volume above average adds points
- Distance from zero line (0-25 points): Crosses near zero line are stronger
This score helps identify high-quality crossovers and can be used as a filter to only accept signals meeting minimum quality threshold.
Filtering System
Histogram Filter:
Requires histogram to be above zero for buy signals, below zero for sell signals. Ensures momentum alignment before generating signals.
Signal Strength Filter:
Requires minimum signal strength score for signals. Higher threshold = only strongest signals pass. This combines multiple confirmation factors into a single filter.
Cross Quality Filter:
Requires minimum cross quality score for signals. Rates crossover quality based on angle, volume, momentum, and distance from zero. Only signals meeting minimum quality threshold will be generated.
All filters use the pattern: filterResult = not filterEnabled OR conditionMet. This means if a filter is disabled, it always passes (returns true). Filters can be combined, and all must pass for a signal to fire.
Multi-Timeframe Analysis
The script can display MACD from a secondary (higher) timeframe and use it for confirmation. When secondary timeframe confirmation is enabled, signals require the higher timeframe MACD to align (bullish/bearish) with the signal direction. This ensures signals align with the larger trend context, reducing counter-trend trades.
Secondary Timeframe MACD:
The secondary timeframe MACD uses the same calculation parameters (fast, slow, signal, MA type) as the main MACD but from a higher timeframe. This provides context for the current timeframe's MACD position relative to the larger trend. The secondary MACD lines are displayed on the chart when enabled.
Noise Filtering
Noise filtering hides small histogram movements below a threshold. This helps focus on significant moves and reduces chart clutter. When enabled, only histogram movements above the threshold are displayed. Typical threshold values are 0.1-0.5 for most instruments, depending on the instrument's price range and volatility.
Signal Debounce
Signal debounce prevents duplicate MACD cross signals within a short time period. Useful when MACD crosses back and forth quickly, creating multiple signals. Debounce ensures only one signal per period, reducing signal spam during choppy markets. This is separate from alert cooldown, which applies to all alert types.
Background Color Modes
The script offers three background color modes:
- Dynamic: Full MACD heatmap based on OB/OS conditions, confidence, and momentum. Provides rich visual feedback.
- Monotone: Soft neutral background but still allows overlays (OB/OS zones). Keeps the chart clean without overpowering candles.
- Off: No MACD background (only overlays and plots). Maximum chart cleanliness.
When OB/OS background colors are enabled, they are drawn on top of the main background to ensure visibility.
Statistics Table
A real-time statistics table displays current MACD values, signal strength, distance from zero line, secondary timeframe alignment, volume confirmation status, and all active filter statuses. The table dynamically adjusts to show only enabled features, keeping it clean and relevant. The table position can be configured (Top Left, Top Right, Bottom Left, Bottom Right).
Performance Statistics Table
An optional performance statistics table shows comprehensive filter diagnostics:
- Total buy/sell signals (raw crossover count before filters)
- Filtered buy/sell signals (signals that passed all filters)
- Overall pass rates (percentage of signals that passed filters)
- Rejected signals count
- Filter-by-filter rejection diagnostics showing which filters rejected how many signals
This table helps optimize filter settings by showing which filters are most restrictive and how they impact signal frequency. The diagnostics format shows rejections as "X B / Y S" (X buy signals rejected, Y sell signals rejected) or "Disabled" if the filter is not active.
Alert System
The script includes separate alert conditions for each signal type:
- MACD Cross: MACD line crosses above/below Signal line (with or without secondary confirmation)
- Zero-Line Cross: MACD crosses above/below zero
- Divergence: Regular and hidden divergence detections
- Secondary Timeframe: Higher timeframe MACD crosses
- Histogram MA Cross: Histogram crosses above/below its moving average
- Histogram Zero Cross: Histogram crosses above/below zero
- StochMACD: StochMACD overbought/oversold entries and %K/%D crosses
- Histogram BB: Histogram touches/breaks Bollinger Bands
- Volume Events: Volume climax and dry-up detections
- OB/OS: MACD entry/exit from overbought/oversold zones
- Strong Top/Bottom: sTop and sBottom signal detections
Each alert type has its own cooldown system to prevent alert spam. The cooldown requires a minimum number of bars between alerts of the same type, reducing duplicate alerts during volatile periods. Alert types can be filtered to only evaluate specific alert types (All, MACD Cross, Zero Line, Divergence, Secondary Timeframe, Histogram MA, Histogram Zero, StochMACD, Histogram BB, Volume Events, OB/OS, Strong Top/Bottom).
How Components Work Together
MACD crossovers provide the primary signal when the MACD line crosses the Signal line. Zero-line crosses indicate momentum shifts and can provide early warning signals. Divergences identify potential reversals before they occur.
Volume confirmation ensures signals occur with sufficient market participation, filtering out low-volume false breakouts. Histogram analysis tools (MA, Bollinger Bands, StochMACD) provide additional context for signal reliability and identify significant histogram zones.
Signal strength combines multiple confirmation factors into a single score, making it easy to filter for only the strongest signals. Cross quality score rates crossover quality to identify high-quality setups. Multi-timeframe confirmation ensures signals align with higher timeframe trends, reducing counter-trend trades.
Usage Instructions
Getting Started:
The default configuration shows MACD(12,26,9) with standard EMA calculations. Start with default settings and observe behavior, then customize settings to match your trading style. You can use configuration presets for quick setup based on your trading style.
Customizing MACD Parameters:
Adjust Fast Length (default 12), Slow Length (default 26), and Signal Length (default 9) based on your trading timeframe. Shorter periods (8,17,7) for faster signals, longer (15,30,12) for smoother signals. You can change the moving average type: EMA for responsiveness, RMA for smoothness, WMA for recent price emphasis.
Price Source Selection:
Choose Close (standard), or alternative sources (HL2, HLC3, OHLC4) for different sensitivity. HL2 uses the midpoint of the high-low range, HLC3 and OHLC4 incorporate more price information.
Histogram Smoothing:
Set smoothing to 1 for raw histogram (no smoothing), or increase (3-5) for smoother histogram that reduces noise. Higher smoothing reduces false signals but may delay signals slightly.
Percentage Mode:
Enable percentage mode when comparing MACD across instruments with different price levels. This normalizes MACD values, making them directly comparable.
Dynamic OB/OS Levels:
The dynamic thresholds automatically adapt to volatility. Adjust the multipliers (default 1.5) to fine-tune sensitivity: higher values (2.0-3.0) = more extreme thresholds (fewer signals), lower (1.0-1.5) = more frequent signals. Adjust the lookback period to control how quickly levels adapt. Enable OB/OS background colors for visual indication of extreme conditions.
Volume Confirmation:
Set volume threshold to 1.0 (default, effectively disabled) or higher (1.2-1.5) for standard confirmation. Higher values require more volume for confirmation. Set to 0.1 to completely disable volume filtering.
Filters:
Enable filters gradually to find your preferred balance. Start with histogram filter for basic momentum alignment, then add signal strength filter (threshold 50+) for moderate signals, then cross quality filter (threshold 50+) for high-quality crossovers. Combine filters for highest-quality signals but expect fewer signals.
Divergence:
Enable divergence detection and adjust pivot lookback parameters. Pivot-based divergence provides more accurate detection using actual pivot points. Hidden divergence is useful for trend-following strategies. Adjust range parameters to filter divergences by time window.
Zero-Line Crosses:
Zero-line cross alerts are automatically available when alerts are enabled. These provide early warning signals for momentum shifts.
Histogram Analysis Tools:
Enable Histogram Moving Average to see histogram trend direction. Enable Histogram Bollinger Bands to identify extreme histogram zones. Enable Stochastic MACD to normalize histogram to 0-100 scale for overbought/oversold identification.
Multi-Timeframe:
Enable secondary timeframe MACD to see higher timeframe context. Enable secondary confirmation to require higher timeframe alignment for signals.
Signal Strength:
Signal strength is automatically calculated and displayed in the statistics table. Use signal strength filter to only accept signals above a threshold (e.g., 50 for moderate, 70+ for strong signals only).
Smart Label Placement:
Configure label placement settings to control label appearance and quality:
- Label Strength Minimum (%): Set threshold (default 75%) to show only strong signals. Higher = fewer, stronger labels
- Label Spacing Multiplier: Adjust spacing (default 1.5x) for better distribution. Higher = more spacing between labels
- Recovery/Decline Confirm (%): Set confirmation requirement (default 15%). Higher = more confirmation, fewer labels
- Enforce Zero Line Polarity: Enable (default) to ensure Buy labels only appear when tracked extreme was below zero, Sell labels only when above zero
- Historical Lookback: Adjust search period (default 20 bars) for finding true extremes. Higher = more history analyzed
Cross Quality:
Cross quality score is automatically calculated for crossovers. Use cross quality filter to only accept high-quality crossovers (threshold 50+ for moderate, 70+ for high quality).
Alerts:
Set up alerts for your preferred signal types. Enable alert cooldown (default enabled, 5 bars) to prevent alert spam. Use alert type filter to only evaluate specific alert types (All, MACD Cross, Zero Line, Divergence, Secondary Timeframe, Histogram MA, Histogram Zero, StochMACD, Histogram BB, Volume Events, OB/OS, Strong Top/Bottom). Each signal type has its own alert condition, so you can be selective about which signals trigger alerts.
Visual Elements and Signal Markers
The script uses various visual markers to indicate signals and conditions:
- MACD Line: Green when above signal (bullish), red when below (bearish) if dynamic colors enabled. Optional black outline for enhanced visibility
- Signal Line: Orange line with optional black outline for enhanced visibility
- Histogram: Color-coded based on direction and momentum (green for bullish rising, lime for bullish falling, red for bearish falling, orange for bearish rising)
- Zero Line: Horizontal reference line at MACD = 0
- Fill to Zero: Green/red semi-transparent fill between MACD line and zero line showing bullish/bearish territory
- Fill Between OB/OS: Blue semi-transparent fill between overbought/oversold thresholds highlighting neutral zone
- OB/OS Background Colors: Background coloring when MACD enters overbought/oversold zones
- Background Colors: Dynamic or monotone backgrounds indicating MACD state, or custom chart background
- Divergence Labels: "🐂" for bullish, "🐻" for bearish, "H Bull" for hidden bullish, "H Bear" for hidden bearish
- Divergence Lines: Colored lines connecting pivot points when divergences are detected
- Volume Climax Markers: ⚡ symbol for extremely high volume
- Volume Dry-Up Markers: 💧 symbol for extremely low volume
- Buy/Sell Strength Labels: Show signal strength percentage (e.g., "Buy Strength: 75%")
- Strong Top/Bottom Labels: "sTop" and "sBottom" for extreme level recoveries
- Secondary MACD Lines: Purple lines showing higher timeframe MACD
- Histogram MA: Orange line showing histogram moving average
- Histogram BB: Blue bands around histogram showing extreme zones
- StochMACD Lines: %K and %D lines with overbought/oversold thresholds
- Regression Forecast: Dotted blue lines extending forward with optional confidence bands
Signal Priority and Interpretation
Signals are generated independently and can occur simultaneously. Higher-priority signals generally indicate stronger setups:
1. MACD Cross with Multiple Filters - Highest priority: Requires MACD crossover plus all enabled filters (histogram, signal strength, cross quality) and secondary timeframe confirmation if enabled. These are the most reliable signals.
2. Zero-Line Cross - High priority: Indicates momentum shift. Can provide early warning signals before MACD crosses the signal line.
3. Divergence Signals - Medium-High priority: Pivot-based divergence is more reliable than simple divergence. Hidden divergence indicates continuation rather than reversal.
4. MACD Cross with Basic Filters - Medium priority: MACD crosses signal line with basic histogram filter. Less reliable alone but useful when combined with other confirmations.
Best practice: Wait for multiple confirmations. For example, a MACD crossover combined with divergence, volume confirmation, and secondary timeframe alignment provides the strongest setup.
Chart Requirements
For proper script functionality and compliance with TradingView requirements, ensure your chart displays:
- Symbol name: The trading pair or instrument name should be visible
- Timeframe: The chart timeframe should be clearly displayed
- Script name: "Ultimate MACD " should be visible in the indicator title
These elements help traders understand what they're viewing and ensure proper script identification. The script automatically includes this information in the indicator title and chart labels.
Performance Considerations
The script is optimized for performance:
- Calculations use efficient Pine Script functions (ta.ema, ta.sma, etc.) which are optimized by TradingView
- Conditional execution: Features only calculate when enabled
- Label management: Old labels are automatically deleted to prevent accumulation
- Array management: Divergence label arrays are limited to prevent memory accumulation
The script should perform well on all timeframes. On very long historical data with many enabled features, performance may be slightly slower, but it remains usable.
Known Limitations and Considerations
- Dynamic OB/OS levels can vary significantly based on recent MACD volatility. In very volatile markets, levels may be wider; in calm markets, they may be narrower.
- Volume confirmation requires sufficient historical volume data. On new instruments or very short timeframes, volume calculations may be less reliable.
- Higher timeframe MACD uses request.security() which may have slight delays on some data feeds.
- Stochastic MACD requires the histogram to have sufficient history. Very short periods on new charts may produce less reliable StochMACD values initially.
- Divergence detection requires sufficient historical data to identify pivot points. Very short lookback periods may produce false positives.
Practical Use Cases
The indicator can be configured for different trading styles and timeframes:
Swing Trading:
Use MACD(12,26,9) with secondary timeframe confirmation. Enable divergence detection. Use signal strength filter (threshold 50+) and cross quality filter (threshold 50+) for higher-quality signals. Enable histogram analysis tools for additional context.
Day Trading:
Use MACD(8,17,7) or use "Day Trading" preset with minimal histogram smoothing for faster signals. Enable zero-line cross alerts for early signals. Use volume confirmation with threshold 1.2-1.5. Enable histogram MA for momentum tracking.
Trend Following:
Use MACD(12,26,9) or longer periods (15,30,12) for smoother signals. Enable secondary timeframe confirmation for trend alignment. Hidden divergence signals are useful for trend continuation entries. Use cross quality filter to identify high-quality crossovers.
Reversal Trading:
Focus on divergence detection (pivot-based for accuracy) combined with zero-line crosses. Enable volume confirmation. Use histogram Bollinger Bands to identify extreme histogram zones. Enable StochMACD for overbought/oversold identification.
Multi-Timeframe Analysis:
Enable secondary timeframe MACD to see context from larger timeframes. For example, use daily MACD on hourly charts to understand the larger trend context. Enable secondary confirmation to require higher timeframe alignment for signals.
Practical Tips and Best Practices
Getting Started:
Start with default settings and observe MACD behavior. The default configuration (MACD 12,26,9 with EMA) is balanced and works well across different markets. After observing behavior, customize settings to match your trading style. Consider using configuration presets for quick setup.
Reducing Repainting:
All signals are based on confirmed bars, minimizing repainting. The script uses confirmed bar data for all calculations to ensure backtesting accuracy.
Signal Quality:
MACD crosses with multiple filters provide the highest-quality signals because they require alignment across multiple indicators. These signals have lower frequency but higher reliability. Use signal strength scores to identify the strongest signals (70+). Use cross quality scores to identify high-quality crossovers (70+).
Filter Combinations:
Start with histogram filter for basic momentum alignment, then add signal strength filter for moderate signals, then cross quality filter for high-quality crossovers. Combining all filters significantly reduces false signals but also reduces signal frequency. Find your balance based on your risk tolerance.
Volume Filtering:
Set volume threshold to 1.0 (default, effectively disabled) or lower to effectively disable volume filtering if you trade instruments with unreliable volume data or want to test without volume confirmation. Standard confirmation uses 1.2-1.5 threshold.
MACD Period Selection:
Standard MACD(12,26,9) provides balanced signals suitable for most trading. Shorter periods (8,17,7) for faster signals, longer (15,30,12) for smoother signals. Adjust based on your timeframe and trading style. Consider using configuration presets for optimized settings.
Moving Average Type:
EMA provides balanced responsiveness with smoothness. RMA is smoother and less responsive. WMA gives more weight to recent prices. SMA gives equal weight to all periods. Choose based on your preference for responsiveness vs. smoothness.
Divergence:
Pivot-based divergence is more reliable than simple divergence because it uses actual pivot points. Hidden divergence indicates continuation rather than reversal, useful for trend-following strategies. Adjust pivot lookback parameters to control sensitivity.
Dynamic Thresholds:
Dynamic OB/OS thresholds automatically adapt to volatility. In volatile markets, thresholds widen; in calm markets, they narrow. Adjust the multipliers to fine-tune sensitivity. Enable OB/OS background colors for visual indication.
Zero-Line Crosses:
Zero-line crosses indicate momentum shifts and can provide early warning signals before MACD crosses the signal line. Enable alerts for zero-line crosses to catch these early signals.
Alert Management:
Enable alert cooldown (default enabled, 5 bars) to prevent alert spam. Use alert type filter to only evaluate specific alert types. Signal debounce (default enabled, 3 bars) prevents duplicate MACD cross signals during choppy markets.
Technical Specifications
- Pine Script Version: v6
- Indicator Type: Non-overlay (displays in separate panel below price chart)
- Repainting Behavior: Minimal - all signals are based on confirmed bars, ensuring accurate backtesting results
- Performance: Optimized with conditional execution. Features only calculate when enabled.
- Compatibility: Works on all timeframes (1 minute to 1 month) and all instruments (stocks, forex, crypto, futures, etc.)
- Edge Case Handling: All calculations include safety checks for division by zero, NA values, and boundary conditions. Alert cooldowns and signal debounce handle edge cases where conditions never occurred or values are NA.
Technical Notes
- All MACD values respect percentage mode conversion when enabled
- Volume confirmation uses cached volume SMA for performance
- Label arrays (divergence) are automatically limited to prevent memory accumulation
- Background coloring: OB/OS backgrounds are drawn on top of main background to ensure visibility
- All calculations are optimized with conditional execution - features only calculate when enabled (performance optimization)
- Signal strength calculation combines multiple factors into a single score for easy filtering
- Cross quality calculation rates crossover quality based on angle, volume, and distance from zero
- Secondary timeframe MACD uses request.security() for higher timeframe data access
- Histogram analysis features (Bollinger Bands, MA, StochMACD) provide additional context beyond basic MACD signals
- Statistics table dynamically adjusts to show only enabled features, keeping it clean and relevant
- Divergence detection uses MACD line (not histogram) for more reliable signals
- Configuration presets automatically optimize MACD parameters for different trading styles
- Smart label placement: Labels appear on current bar at confirmation, using strength from tracked extreme point
- Label spacing uses effective distance (base distance × spacing multiplier) for better distribution
- Zero line polarity enforcement ensures Buy labels only appear when tracked extreme MACD < 0, Sell labels only when tracked extreme MACD > 0
- Label finalization requires MACD exit from OB/OS zone, sufficient bars passed, and recovery/decline percentage confirmation
- Strength-based filtering automatically compares and keeps only the strongest label when multiple signals are close together
- Enhanced visualization: Line outlines drawn behind main lines for superior visibility (black default, configurable)
- Enhanced visualization: Fill between MACD and zero line provides instant visual feedback (green above, red below)
- Enhanced visualization: Fill between OB/OS thresholds highlights neutral zone when dynamic levels are active
- Custom chart background overrides background mode when enabled, allowing theme-consistent indicator panels

[GrandAlgo] Moving Averages Cross LevelsMoving Averages Cross Levels
Many traders watch for moving average crossovers – such as the golden cross (50 MA crossing above 200 MA) or death cross – as signals of changing trends. However, once a crossover happens, the exact price level where it occurred often fades from view, even though that level can be an important reference point. Moving Averages Cross Levels is an indicator that keeps those crossover price levels visible on your chart, helping you track where momentum shifts occurred and how price behaves relative to those key levels.
This tool plots horizontal line segments at the price where each pair of selected moving averages crossed within a recent window of bars. Each level is labeled with the moving average lengths (for example, “21×50” for a 21/50 MA cross) and is color-coded – green for bullish crossovers (short-term MA crossing above long-term MA) and red for bearish crossunders (short-term crossing below). By visualizing these crossover levels, you can quickly identify past trend change points and use them as potential support/resistance or decision levels in your trading. Importantly, this indicator is non-repainting – once a crossover level is plotted, it remains fixed at the historical price where the cross occurred, allowing you to continually monitor that level going forward. (As with any moving average-based analysis, crossover signals are lagging, so use these levels in conjunction with other tools for confirmation.)
Key Features:
✅ Multiple Moving Averages: Track up to 7 different MAs (e.g. 5, 8, 21, 50, 64, 83, 200 by default) simultaneously. You can enable/disable each MA and set its length, allowing flexible combinations of short-term and long-term averages.
✅ Selectable MA Type: Each average can be calculated as a Simple (SMA), Exponential (EMA), Volume-Weighted (VWMA), or Smoothed (RMA) moving average, giving you flexibility to match your preferred method.
✅ Auto Crossover Detection: The script automatically detects all crosses between any enabled MA pairs, so you don’t have to specify pairs manually. Whether it’s a fast cross (5×8) or a long-term cross (50×200), every crossover within the lookback period will be identified and marked.
✅ Horizontal Level Markers: For each detected crossover, a horizontal line segment is drawn at the exact price where the crossover occurred. This makes it easy to glance at your chart and see precisely where two moving averages intersected in the recent past.
✅ Labeled and Color-Coded: Each crossover line is labeled with the two MA lengths that crossed (e.g. “50×200”) for clear identification. Colors indicate crossover direction – by default green for bullish (positive) crossovers and red for bearish (negative) crossovers – so you can tell at a glance which way the trend shifted. (You can customize these colors in the settings.)
✅ Adjustable Lookback: A “Crosses with X candles” input lets you control how far back the script looks for crossovers to plot. This prevents your chart from getting cluttered with too many old levels – for example, set X = 100 to show crossovers from roughly the last 100 bars. Older crossover lines beyond this lookback window will automatically clear off the chart.
✅ Optional MA Plots: You can toggle the display of each moving average line on the chart. This means you can either view just the crossover levels alone for a clean look, or also overlay the MA curves themselves for additional context (to see how price and MAs were moving around the crossover).
✅ No Repainting or Hindsight Bias: Once a crossover level is plotted, it stays at that fixed price. The indicator doesn’t move levels around after the fact – each line is a true historical event marker. This allows you to backtest visually: see how price acted after the crossover by observing if it retested or respected that level later.
How It Works:
1️⃣ Add to Chart & Configure – Simply add the indicator to your chart. In the settings, choose which moving averages you want to include and set their lengths. For example, you might enable 21, 50, 200 to focus on medium and long-term crosses (including the golden cross), or turn on shorter MAs like 5 and 8 for quick momentum shifts. Adjust the lookback (number of bars to scan for crosses) if needed.
2️⃣ Visualization – The script continuously checks the latest X bars for any points where one MA crossed above or below another. Whenever a crossover is found, it calculates the exact price level at which the two moving averages intersected. On the last bar of your chart, it will draw a horizontal line segment extending from the crossover bar to the current bar at that price level, and place a label to the right of the line with the MA lengths. Green lines/labels signify bullish crossovers (where the first MA crossed above the second), and red lines indicate bearish crossunders.
3️⃣ On Your Chart – You will see these labeled levels aligned with the price scale. For example, if a 50 MA crossed above a 200 MA (bullish) 50 bars ago at price $100, there will be a green “50×200” line at $100 extending to the present, showing you exactly where that golden cross happened. You might notice price pulling back near that level and bouncing, or if price falls back through it, it could signal a failed crossover. The indicator updates in real-time: if a new crossover happens on the latest bar, a new line and label will instantly appear, and if any old cross moves out of the lookback range, its line is removed to keep the chart focused.
4️⃣ Customization – You can fine-tune the appearance: toggle any MA’s visibility, change line colors or label styles, and modify the lookback length to suit different timeframes. For instance, on a 1-hour chart you might use a lookback of 500 bars to see a few weeks of cross history, whereas on a daily chart 100 bars (about 4–5 months) may be sufficient. Adjust these settings based on how many crossover levels you find useful to display.
Ideal for Traders Who:
Use MA Crossovers in Strategy: If your strategy involves moving average crossovers (for trend confirmation or entry/exit signals), this indicator provides an extra layer of insight by keeping the price of those crossover events in sight. For example, trend-followers can watch if price stays above a bullish crossover level as a sign of trend strength, or falls below it as a sign of weakness.
Identify Support/Resistance from MA Events: Crossover levels often coincide with pivot points in market sentiment. A crossover can act like a regime change – the level where it happened may turn into support or resistance. This tool helps you mark those potential S/R levels automatically. Rather than manually noting where a golden cross occurred, you’ll have it highlighted, which can be useful for setting stop-losses (e.g. below the crossover price in a bullish scenario) or profit targets.
Track Multiple Averages at Once: Instead of focusing on just one pair of moving averages, you might be interested in the interaction of several (short, medium, and long-term trends). This indicator caters to that by plotting all relevant crossovers among your chosen MAs. It’s great for multi-timeframe thinkers as well – e.g. you could apply it on a higher timeframe chart to mark major cross levels, then drill down to lower timeframes knowing those key prices.
Value Clean Visualization: There are no flashing signals or arrows – just simple lines and labels that enhance your chart’s storytelling. It’s ideal if you prefer to make trading decisions based on understanding price interaction with technical levels rather than following automatic trade calls. Moving Averages Cross Levels gives you information to act on, without imposing any bias or strategy – you interpret the crossover levels in the context of your own trading system.

UtilityLibrary "Utility"
A utility library for various trading tools such as signal generation, custom indicators, and multi-condition crossovers.
multiCrossover(source1, source2, threshold1, threshold2)
multiCrossover
@description Detects multi-condition crossovers between two sources with threshold filters.
Parameters:
source1 (float) : The first data series to compare.
source2 (float) : The second data series to compare.
threshold1 (float) : A value that source1 must exceed to trigger the crossover.
threshold2 (float) : A value that source2 must exceed to trigger the crossunder.
Returns: A tuple: (crossUp, crossDown) where crossUp is a boolean for upward crossover, and crossDown is for downward crossover.
macdCustom(source, fastLength, slowLength, signalLength, macdThresh)
macdCustom
@description Calculates custom MACD signals based on thresholds.
Parameters:
source (float) : The price data or input series.
fastLength (simple int) : The length of the fast EMA.
slowLength (simple int) : The length of the slow EMA.
signalLength (simple int) : The signal line length.
macdThresh (float) : A threshold for the MACD line to confirm buy/sell signals.
Returns: A tuple: (macdBuySignal, macdSellSignal) where macdBuySignal is true when MACD crosses above, and macdSellSignal is true when MACD crosses below the signal line.
combinedMacdRsi(source, fastLength, slowLength, signalLength, rsiLength, macdThresh, rsiThresh)
combinedMacdRsi
@description Generates combined signals from MACD and RSI indicators.
Parameters:
source (float) : The price data or input series.
fastLength (simple int) : The length of the fast EMA for MACD.
slowLength (simple int) : The length of the slow EMA for MACD.
signalLength (simple int) : The signal line length for MACD.
rsiLength (simple int) : The length of the RSI calculation.
macdThresh (float) : The threshold for MACD signals.
rsiThresh (float) : The threshold for RSI signals.
Returns: A tuple: (buySignal, sellSignal) where buySignal is generated when MACD is positive and RSI is below the threshold, and sellSignal when MACD is negative and RSI is above the threshold.
movingAverageCrossover(source, shortLength, longLength)
movingAverageCrossover
@description Detects crossovers between short-term and long-term moving averages.
Parameters:
source (float) : The price data or input series.
shortLength (int) : The length of the short-term moving average.
longLength (int) : The length of the long-term moving average.
Returns: A tuple: (crossUp, crossDown) where crossUp is true when the short-term MA crosses above the long-term MA, and crossDown when the reverse occurs.
Commodity Channel Index CCI + EMA strategy
================================================================================
COMMODITY CHANNEL INDEX CCI + EMA STRATEGY - STRATEGY GUIDE 📊
================================================================================
💡 COLLABORATION & SUPPORT
---------------------------
If you want to collaborate, have an idea for a strategy, or need help writing
or customizing code, send an email to burdytrader@gmail.com or send me a
message. Suggestions, ideas, and comments are always welcome! 🤝
I also develop automated trading codes for other trading platforms including:
- CTrader (C#)
- MetaTrader 4 (MQL4)
- MetaTrader 5 (MQL5)
If you need a strategy converted or developed for any of these platforms, feel
free to contact me!
================================================================================
⚠️ IMPORTANT: INSTRUMENT SELECTION 📈
-------------------------------------
This strategy performs BEST with currency pairs (forex). The CCI indicator
works particularly well in the forex market due to the nature of currency
movements and the effectiveness of the CCI in identifying overbought and
oversold conditions in trending markets.
Why Currency Pairs? 🎯
- CCI is highly effective in identifying reversals in forex markets
- Currency pairs show clear overbought/oversold patterns
- EMA filter (50/200) aligns well with major forex trends
- High liquidity ensures reliable signal execution
Performance Highlights:
In specific currency pairs, when properly configured, this strategy can achieve:
- Profit Factor: Over 2.0
- Win Rate: Up to 70%
- Particularly effective pairs: USDCAD, EURUSD, GBPJPY
While the strategy can work with other instruments (stocks, indices, commodities),
currency pairs provide the most consistent and reliable results. For optimal
performance, focus on major forex pairs with good liquidity and clear trending
characteristics.
================================================================================
WHAT DOES THIS STRATEGY DO? 🎯
---------------------------
This strategy combines the Commodity Channel Index (CCI) with Exponential
Moving Averages (EMA) to identify high-probability trading opportunities.
The strategy uses CCI crossovers with a smoothing moving average and filters
signals using EMA trend confirmation. The strategy automatically enters trades
when CCI crosses the smoothing MA in specific zones, indicating potential trend
reversals or continuations.
HOW IT WORKS? ⚙️
---------------
1. CCI CALCULATION 📈
The strategy calculates the Commodity Channel Index using:
- CCI = (Price - SMA(Price, length)) / (0.015 × Deviation(Price, length))
- Default length: 20 periods
- Source: HLC3 (typical price)
The CCI shows:
- Values above +100 = Overbought conditions
- Values below -100 = Oversold conditions
- Values around 0 = Neutral conditions
2. SMOOTHING MOVING AVERAGE 📊
A moving average is applied to the CCI to smooth out fluctuations:
- Types available: SMA, EMA, SMMA (RMA), WMA, VWMA
- Default: SMA with length 14
- Can be disabled (set to "None")
This smoothed line acts as a reference for crossover signals.
3. EMA TREND FILTER 🎯
Two EMAs are calculated on the CCI:
- EMA 50 (fast EMA)
- EMA 200 (slow EMA)
When the EMA filter is enabled:
- LONG signals only occur when EMA50 > EMA200 (uptrend confirmation)
- SHORT signals only occur when EMA50 < EMA200 (downtrend confirmation)
This filter can be enabled/disabled via the "Use EMA Filter" option.
4. ENTRY CONDITIONS 🎲
LONG ENTRY (Buy Signal):
- CCI crosses ABOVE the Smoothing MA (crossover)
- CCI is between Lower Level (-100) and Middle Level (0)
- EMA Filter: EMA50 > EMA200 (if filter enabled)
- No existing positions (or close opposite positions first)
SHORT ENTRY (Sell Signal):
- CCI crosses BELOW the Smoothing MA (crossunder)
- CCI is between Middle Level (0) and Upper Level (+100)
- EMA Filter: EMA50 < EMA200 (if filter enabled)
- No existing positions (or close opposite positions first)
5. POSITION MANAGEMENT 💰
The strategy uses a simple position management approach:
- Only ONE position at a time (no pyramiding)
- If a signal occurs in the opposite direction, closes existing position first
- Then opens new position in the new direction
- This prevents overexposure and simplifies risk management
6. TAKE PROFIT & STOP LOSS SETTINGS 🎯
The strategy uses percentage-based TP/SL:
- Take Profit: 1.0% (default, configurable)
- Stop Loss: 0.5% (default, configurable)
- Risk/Reward Ratio: 2:1 (TP is double the SL)
TP/SL are calculated once when the position opens and remain fixed.
AVAILABLE PARAMETERS ⚙️
-----------------------
CCI SETTINGS:
1. CCI Length (Default: 20)
- Period for CCI calculation
- Lower values = More sensitive to recent price action
- Higher values = More smoothed, less sensitive
2. CCI Source (Default: HLC3)
- Price source for CCI calculation
- Options: close, open, high, low, hlc3, hlcc4, ohlc4
3. CCI Lower Level (Default: -100)
- Lower boundary for LONG entry zone
- Typically -100 for oversold conditions
4. CCI Middle Level (Default: 0)
- Neutral level separating LONG and SHORT zones
5. CCI Upper Level (Default: +100)
- Upper boundary for SHORT entry zone
- Typically +100 for overbought conditions
SMOOTHING MA:
6. Type (Default: SMA)
- Moving average type: None, SMA, EMA, SMMA (RMA), WMA, VWMA
- Set to "None" to disable smoothing
7. Length (Default: 14)
- Period for smoothing MA
- Range: 7-28, step 7
EMA FILTER:
8. EMA 1 Length (Default: 50)
- Fast EMA period applied to CCI
9. EMA 2 Length (Default: 200)
- Slow EMA period applied to CCI
10. Use EMA Filter (Default: true)
- Enable/disable EMA trend filter
- When enabled: LONG only if EMA50 > EMA200, SHORT only if EMA50 < EMA200
RISK MANAGEMENT:
11. Take Profit (%) (Default: 1.0%)
- Profit target as percentage of entry price
- For LONG: Entry × (1 + TP%)
- For SHORT: Entry × (1 - TP%)
12. Stop Loss (%) (Default: 0.5%)
- Stop loss as percentage of entry price
- For LONG: Entry × (1 - SL%)
- For SHORT: Entry × (1 + SL%)
VISUALIZATION 📊
---------------
The strategy displays in a separate panel below the price chart:
1. CCI LINE
- Blue line showing the CCI value
- Oscillates around zero
2. SMOOTHING MA LINE
- Yellow line showing the smoothed CCI
- Reference line for crossover signals
3. CCI LEVEL LINES
- Red dashed line: Upper Level (+100)
- Green dashed line: Lower Level (-100)
- Yellow dashed line: Middle Level (0)
4. ENTRY SIGNALS
- Green cross: LONG entry signal (when CCI crosses above MA)
- Red cross: SHORT entry signal (when CCI crosses below MA)
RECOMMENDED SETTINGS 🎯
-----------------------
To get started, you can use these settings:
CCI SETTINGS:
- CCI Length: 20 (default)
- CCI Source: HLC3 (default)
- CCI Lower Level: -100 (default)
- CCI Middle Level: 0 (default)
- CCI Upper Level: +100 (default)
SMOOTHING MA:
- Type: SMA (default) or EMA for faster response
- Length: 14 (default)
EMA FILTER:
- EMA 1 Length: 50 (default)
- EMA 2 Length: 200 (default)
- Use EMA Filter: true (recommended for better signal quality)
RISK MANAGEMENT:
- Take Profit (%): 1.0% (adjust based on your risk/reward preference)
- Stop Loss (%): 0.5% (adjust based on your risk tolerance)
For more aggressive trading:
- Reduce CCI Length to 14-16
- Reduce Smoothing MA Length to 7
- Disable EMA Filter
For more conservative trading:
- Increase CCI Length to 24-30
- Increase Smoothing MA Length to 21-28
- Keep EMA Filter enabled
RECOMMENDED CURRENCY PAIRS 💱
------------------------------
This strategy is optimized for currency pairs and performs exceptionally well
on the following pairs when properly configured:
TOP PERFORMING PAIRS:
- USDCAD: Can achieve Profit Factor > 2.0 and Win Rate up to 70%
- EURUSD: Excellent performance with consistent signals
- GBPJPY: Strong results with proper EMA filter configuration
These pairs have shown the best historical performance due to:
- Clear trending characteristics
- Good response to CCI overbought/oversold levels
- Strong alignment with EMA 50/200 trend filter
- High liquidity ensuring reliable execution
When trading these pairs, use the default settings or slightly adjusted
parameters based on the pair's volatility. Always backtest on historical
data before using real money to find the optimal configuration for each
specific pair.
PRACTICAL EXAMPLE 📝
--------------------
Scenario: LONG Entry on EUR/USD
1. Market conditions:
- Price: 1.1000
- CCI: -80 (in oversold zone)
- Smoothing MA: -90
- CCI crosses above Smoothing MA (crossover occurs)
- EMA50: -50, EMA200: -70 (EMA50 > EMA200, uptrend confirmed)
2. Strategy checks conditions:
✓ Smoothing MA enabled: Yes
✓ Crossover: Yes (CCI crosses above MA)
✓ CCI in range: Yes (-100 <= -80 <= 0)
✓ EMA Filter: Yes (EMA50 > EMA200)
✓ No existing position: Yes
3. Strategy opens position:
- Direction: LONG (Buy)
- Entry: 1.1000 (current close)
- Take Profit: 1.1110 (1.0% above entry)
- Stop Loss: 1.0945 (0.5% below entry)
- Risk/Reward: 2:1
4. Outcome scenarios:
- If price rises to 1.1110 → Take Profit hit (profit)
- If price falls to 1.0945 → Stop Loss hit (loss limited)
IMPORTANT NOTE ⚠️
-----------------
This strategy is a technical analysis tool based on CCI and EMA indicators.
Like all trading strategies, it does NOT guarantee profits. Trading involves
significant risks and you can lose money, including your entire investment.
Past performance does not guarantee future results.
Always:
- Use appropriate risk management
- Never risk more than you can afford to lose
- Test the strategy on historical data (backtesting) before using real money
- Start with small position sizes or paper trading
- Understand that no strategy works 100% of the time
- Consider market conditions, news events, and other factors
- Keep a trading journal to learn and improve
The author and contributors are NOT responsible for any losses incurred from
using this strategy. Trading decisions are your own responsibility. Profits
are NOT guaranteed, and losses are possible.
LICENSE 📄
----------
This code is open source and available for modification. You are free to use,
modify, and distribute this strategy. If you republish or share a modified
version, please kindly mention the original author.
================================================================================

DAMA OSC - Directional Adaptive MA OscillatorOverview:
The DAMA OSC (Directional Adaptive MA Oscillator) is a highly customizable and versatile oscillator that analyzes the delta between two moving averages of your choice. It detects trend progression, regressions, rebound signals, MA cross and critical zone crossovers to provide highly contextual trading information.
Designed for trend-following, reversal timing, and volatility filtering, DAMA OSC adapts to market conditions and highlights actionable signals in real-time.
Features:
Support for 11 custom moving average types (EMA, DEMA, TEMA, ALMA, KAMA, etc.)
Customizable fast & slow MA periods and types
Histogram based on percentage delta between fast and slow MA
Trend direction coloring with “Green”, “Blue”, and “Red” zones
Rebound detection using close or shadow logic
Configurable thresholds: Overbought, Oversold, Underbought, Undersold
Optional filters: rebound validation by candle color or flat-zone filter
Full visual overlay: MA lines, crossover markers, rebound icons
Complete alert system with 16 preconfigured conditions
How It Works:
Histogram Logic:
The histogram measures the percentage difference between the fast and slow MA:
hist_value = ((FastMA - SlowMA) / SlowMA) * 100
Trend State Logic (Green / Blue / Red):
Green_Up = Bullish acceleration
Blue_Up (or Red_Up, depending the display settings) = Bullish deceleration
Blue_Down (or Green_Down, depending the display settings) = Bearish deceleration
Red_Down = Bearish acceleration
Rebound Logic:
A rebound is detected when price:
Crosses back over a selected MA (fast or slow)
After being away for X candles (rebound_backstep)
Optional: filtered by histogram zones or candle color
Inputs:
Display Options:
Show/hide MA lines
Show/hide MA crosses
Show/hide price rebounds
Enable/disable blue deceleration zones
DAMA Settings:
Fast/Slow MA type and length
Source input (close by default)
Overbought/Oversold levels
Underbought/Undersold levels
Rebound Settings:
Use Close and/or Shadow
Rebound MA (Fast/Slow)
Candle color validation
Flat zone filter rebounds (between UnderSold and UnderBought)
Available MA type:
SMA (Simple MA)
EMA (Exponential MA)
DEMA (Double EMA)
TEMA (Triple EMA)
WMA (Weighted MA)
HMA (Hull MA)
VWMA (Volume Weighted MA)
Kijun (Ichimoku Baseline)
ALMA (Arnaud Legoux MA)
KAMA (Kaufman Adaptive MA)
HULLMOD (Modified Hull MA, Same as HMA, tweaked for Pine v6 constraints)
Notes:
**DEMA/TEMA** reduce lag compared to EMA, useful for faster reaction in trending markets.
**KAMA/ALMA** are better suited to noisy or volatile environments (e.g., BTC).
**VWMA** reacts strongly to volume spikes.
**HMA/HULLMOD** are great for visual clarity in fast moves.
Alerts Included (Fully Configurable):
Golden Cross:
Fast MA crosses above Slow MA
Death Cross:
Fast MA crosses below Slow MA
Bullish Rebound:
Rebound from below MA in uptrend
Bearish Rebound:
Rebound from above MA in downtrend
Bull Progression:
Transition into Green_Up with positive delta
Bear Progression:
Transition into Red_Down with negative delta
Bull Regression:
Exit from Red_Down into Blue/Green with negative delta
Bear Regression:
Exit from Green_Up into Blue/Red with positive delta
Crossover Overbought:
Histogram crosses above Overbought
Crossunder Overbought:
Histogram crosses below Overbought
Crossover Oversold:
Histogram crosses above Oversold
Crossunder Oversold:
Histogram crosses below Oversold
Crossover Underbought:
Histogram crosses above Underbought
Crossunder Underbought:
Histogram crosses below Underbought
Crossover Undersold:
Histogram crosses above Undersold
Crossunder Undersold:
Histogram crosses below Undersold
Credits:
Created by Eff_Hash. This code is shared with the TradingView community and full free. do not hesitate to share your best settings and usage.

Advanced Trend and Volatility Indicator with Alerts by ZaimonThis script presents a comprehensive analytical tool that integrates multiple technical indicators to provide a holistic view of market trends and volatility. By uniquely combining Moving Averages (MA), Relative Strength Index (RSI), Stochastic Oscillator, Bollinger Bands, and Average True Range (ATR), it offers nuanced insights into price movements and helps identify potential trading opportunities.
---
### **Key Features and Integration:**
1. **Moving Averages (MA20 & MA50):**
- **Trend Identification:**
- **Methodology:** Calculates two Simple Moving Averages—MA20 (short-term) and MA50 (long-term).
- **Bullish Trend:** When MA20 crosses above MA50, indicating upward momentum.
- **Bearish Trend:** When MA20 crosses below MA50, signaling downward momentum.
- **Golden Cross & Death Cross Alerts:**
- **Golden Cross:** MA20 crossing above MA50 generates a bullish alert and visual symbol.
- **Death Cross:** MA20 crossing below MA50 triggers a bearish alert and visual symbol.
- **Integration:**
- Serves as the foundational trend indicator, influencing interpretations of other indicators within the script.
2. **Relative Strength Index (RSI):**
- **Momentum Measurement:**
- **Methodology:** Calculates RSI to assess the speed and change of price movements over a 14-period length.
- **Overbought/Oversold Conditions:** Customizable thresholds set at 70 (overbought) and 30 (oversold).
- **Alerts:**
- Generates alerts when RSI crosses above or below the specified thresholds.
- **Integration:**
- Confirms trend strength identified by MAs.
- Overbought/Oversold signals can precede potential trend reversals, especially when aligned with MA crossovers.
3. **Stochastic Oscillator:**
- **Momentum and Reversal Signals:**
- **Methodology:** Uses %K and %D lines to evaluate price momentum relative to high-low range over recent periods.
- **Bullish Signal:** %K crossing above %D in oversold territory (below 20).
- **Bearish Signal:** %K crossing below %D in overbought territory (above 80).
- **Alerts:**
- Provides alerts on bullish and bearish crossovers in extreme regions.
- **Integration:**
- Enhances RSI signals by providing additional momentum confirmation.
- When both RSI and Stochastic indicate overbought/oversold conditions, it strengthens the likelihood of a reversal.
4. **Bollinger Bands:**
- **Volatility Visualization:**
- **Methodology:** Plots upper and lower bands based on standard deviations from a moving average (BB Basis).
- **Dynamic Support/Resistance:** Prices touching or exceeding the bands may indicate potential reversals.
- **Integration:**
- Works with RSI and Stochastic to identify overextended price movements.
- Helps in assessing volatility alongside trend and momentum indicators.
5. **Average True Range (ATR):**
- **Volatility Assessment:**
- **Methodology:** Calculates ATR over a 14-period length to measure market volatility.
- **ATR Bands:** Plots upper and lower bands relative to the current price using an ATR multiplier.
- **Integration:**
- Assists in setting stop-loss and take-profit levels based on current volatility.
- Complements Bollinger Bands for a comprehensive volatility analysis.
6. **Information Table:**
- **Real-Time Data Display:**
- Shows current values of MA20, MA50, RSI, Stochastic %K and %D, BB Basis, ATR, and Trend Status.
- **Trend Status Indicator:**
- Displays "Bullish," "Bearish," or "Sideways" based on MA conditions.
- **Integration:**
- Provides a consolidated view for quick decision-making without analyzing individual indicators separately.
7. **Periodic Labels:**
- **Enhanced Visibility:**
- Adds labels every 50 bars showing RSI and Stochastic values.
- **Integration:**
- Helps track momentum changes over time and spot longer-term patterns.
---
### **How the Components Work Together:**
- **Synergistic Analysis:**
- **Trend Confirmation:** MA crossovers establish the primary trend, while RSI and Stochastic confirm momentum within that trend.
- **Volatility Context:** Bollinger Bands and ATR provide context on market volatility, refining entry and exit points suggested by trend and momentum indicators.
- **Signal Strength:** Concurrent signals from multiple indicators increase confidence in trading decisions.
---
### **Usage Guidelines:**
1. **Trend Analysis:**
- **Identify Trend Direction:**
- Observe MA20 and MA50 crossovers.
- Refer to the Trend Status in the information table.
- **Confirm with Momentum Indicators:**
- Ensure RSI and Stochastic support the identified trend.
2. **Entry and Exit Points:**
- **Overbought/Oversold Conditions:**
- Look for RSI and Stochastic reaching extreme levels.
- Consider entering positions when oversold in a bullish trend or overbought in a bearish trend.
- **Bollinger Band Interactions:**
- Use price interactions with Bollinger Bands to identify potential reversal zones.
3. **Risk Management:**
- **ATR-Based Levels:**
- Set stop-loss and take-profit levels using ATR bands to account for current volatility.
- **Adjusting to Volatility:**
- Modify position sizes and targets based on Bollinger Band width and ATR values.
4. **Alerts Setup:**
- **Customize Alert Thresholds:**
- Configure alerts for MA crossovers, RSI levels, and Stochastic crossovers according to your trading strategy.
- **Stay Informed:**
- Use alerts to monitor key events without constant chart observation.
---
### **Customization:**
- **Flexible Parameters:**
- All indicator lengths, thresholds, and settings are adjustable to suit different trading styles and timeframes.
- **Adjustable Visuals:**
- Modify plot colors, line styles, and label positions to enhance chart readability.
---
### **Originality and Value Addition:**
This script differentiates itself by:
- **Integrated Approach:**
- Seamlessly combining multiple indicators to provide a more comprehensive analysis than using each indicator separately.
- **Enhanced Visualization:**
- Utilizing plots, fills, labels, and an information table to present data intuitively.
- **User-Friendly Features:**
- Pre-configured alerts and real-time data displays reduce the need for manual monitoring.
By explaining how each component interacts and contributes to the overall analysis, the script adds substantial value to traders seeking a multi-faceted tool for market analysis.
---
### **Additional Notes:**
- **Learning Resource:**
- The script is well-commented, serving as an educational tool for those learning Pine Script and technical analysis integration.
- **Further Enhancements:**
- Opportunities exist to incorporate additional indicators like MACD or ADX, and to develop advanced alert logic, such as RSI or Stochastic divergences.
---
### **Disclaimer:**
- **Educational Purpose Only:**
- This script is provided for informational purposes and should not be construed as financial advice.
- **Risk Acknowledgment:**
- Trading involves significant risk; past performance is not indicative of future results.
- **Due Diligence:**
- Users should conduct their own analysis and consider consulting a financial professional before making trading decisions.
---
By providing detailed explanations of the methodologies and the synergistic use of multiple indicators, this script aligns with TradingView's guidelines for originality and usefulness. It offers traders a unique tool that enhances market analysis through the thoughtful integration of technical indicators.

MA SMART Angle
### 📊 WHAT IS MA SMART ANGLE?
**MA SMART Angle** is an advanced momentum and trend detection indicator that analyzes the angles (slopes) of multiple moving averages to generate clear, non-repainting BUY and SELL signals.
**Original Concept Credit:** This indicator builds upon the "MA Angles" concept originally created by **JD** (also known as Duyck). The core angle calculation methodology and Jurik Moving Average (JMA) implementation by **Everget** are preserved from the original open-source work. The angle calculation formula was contributed by **KyJ**. This enhanced version is published with respect to the open-source nature of the original indicator.
Original indicator reference: "ma angles - JD" by Duyck
---
## 🎯 ORIGINALITY & VALUE PROPOSITION
### **What Makes This Different from the Original:**
While the original "MA Angles" by **JD** provided excellent angle visualization, it lacked actionable entry signals. **MA SMART Angle** addresses this by adding:
**1. Clear Entry/Exit Signals**
- Explicit BUY/SELL arrows based on angle crossovers, momentum confirmation, and MA alignment
- No guessing when to enter trades - the indicator tells you exactly when conditions align
**2. Non-Repainting Logic**
- All signals use confirmed historical data (shifted by 2 bars minimum)
- Critical for backtesting reliability and live trading confidence
- Original indicator could repaint signals on current bar
**3. Dual Signal System**
- **Simple Mode:** More frequent signals based on angle crossovers + momentum (for active traders)
- **Strict Mode:** Requires full multi-MA alignment + momentum confirmation (for conservative traders)
- Adaptable to different trading styles and risk tolerances
**4. Smart Signal Filtering**
- **Anti-spam cooldown:** Prevents duplicate signals within configurable bar count
- **No-trade zone detection:** Filters out low-conviction sideways markets automatically
- **Multi-timeframe MA alignment:** Ensures all moving averages agree on direction before signaling
**5. Enhanced Visualization**
- Large, clear BUY/SELL arrows with descriptive labels
- Color-coded backgrounds for market states (trending vs. ranging)
- Momentum histogram showing acceleration/deceleration in real-time
- Live status table displaying trend strength, angle value, momentum, and MA alignment
**6. Professional Alert System**
- Four distinct alert conditions: BUY Signal, SELL Signal, Strong BUY, Strong SELL
- Enables automated trade notifications and strategy integration
**7. Modified MA Periods**
- Original used EMA(27), EMA(83), EMA(278)
- Enhanced version uses faster EMA(3), EMA(8), EMA(13) for more responsive signals
- Better suited for modern volatile markets and shorter timeframes
---
## 📐 HOW IT WORKS - TECHNICAL EXPLANATION
### **Core Methodology:**
The indicator calculates angles (slopes) for five key moving averages:
- **JMA (Jurik Moving Average)** - Smooth, lag-reduced trend line (original implementation by **Everget**)
- **JMA Fast** - Responsive momentum indicator with higher power parameter
- **MA27 (EMA 3)** - Primary fast-moving average for signal generation
- **MA83 (EMA 8)** - Medium-term trend confirmation
- **MA278 (EMA 13)** - Slower trend filter
### **Angle Calculation Formula (by KyJ):**
```
angle = arctan((MA - MA ) / ATR(14)) × (180 / π)
```
**Why ATR normalization?**
- Makes angles comparable across different instruments (forex, stocks, crypto)
- Makes angles comparable across different timeframes
- Accounts for volatility - a 10-point move in different assets has different significance
**Angle Interpretation:**
- **> 15°** = Strong trend (momentum accelerating)
- **0° to 15°** = Weak trend (momentum present but moderate)
- **-2° to +2°** = No-trade zone (sideways/choppy market)
- **< -15°** = Strong downtrend
### **Signal Generation Logic:**
#### **BUY Signal Conditions:**
1. MA27 angle crosses above 0° (upward momentum initiates)
2. All three EMAs (3, 8, 13) pointing upward (trend alignment confirmed)
3. Momentum is positive for 2+ bars (acceleration, not deceleration)
4. Angle exceeds minimum threshold (not in no-trade zone)
5. Cooldown period passed (prevents signal spam)
#### **SELL Signal Conditions:**
1. MA27 angle crosses below 0° (downward momentum initiates)
2. All three EMAs pointing downward (downtrend alignment)
3. Momentum is negative for 2+ bars
4. Angle below negative threshold (not in no-trade zone)
5. Cooldown period passed
#### **Strong BUY+ / SELL+ Signals:**
Additional entry opportunities when JMA Fast crosses JMA Slow while maintaining strong directional angle - indicates momentum acceleration within established trend.
---
## 🔧 HOW TO USE
### **Recommended Settings by Trading Style:**
**Scalpers / Day Traders:**
- Signal Type: **Simple**
- Minimum Angle: **3-5°**
- Cooldown Bars: **3-5 bars**
- Timeframes: 1m, 5m, 15m
**Swing Traders:**
- Signal Type: **Strict**
- Minimum Angle: **7-10°**
- Cooldown Bars: **8-12 bars**
- Timeframes: 1H, 4H, Daily
**Position Traders:**
- Signal Type: **Strict**
- Minimum Angle: **10-15°**
- Cooldown Bars: **15-20 bars**
- Timeframes: Daily, Weekly
### **Parameter Descriptions:**
**1. Source** (default: OHLC4)
- Price data used for MA calculations
- OHLC4 provides smoothest angles
- Close is more responsive but noisier
**2. Threshold for No-Trade Zones** (default: 2°)
- Angles below this are considered sideways/ranging
- Increase for stricter filtering of choppy markets
- Decrease to allow signals in quieter trending periods
**3. Signal Type** (Simple vs. Strict)
- **Simple:** Angle crossover OR (trend + momentum)
- **Strict:** Angle crossover AND all MAs aligned AND momentum confirmed
- Start with Simple, switch to Strict if too many false signals
**4. Minimum Angle for Signal** (default: 5°)
- Only generate signals when angle exceeds this threshold
- Higher values = stronger trends required
- Lower values = more sensitive to momentum changes
**5. Cooldown Bars** (default: 5)
- Minimum bars between consecutive signals
- Prevents spam during volatile chop
- Scale with your timeframe (higher TF = more bars)
**6. Color Bars** (default: true)
- Colors chart bars based on signal state
- Green = bullish conditions, Red = bearish conditions
- Can disable if you prefer clean price bars
**7. Background Colors**
- **Yellow background** = No-trade zone (low angle, ranging market)
- **Green flash** = BUY signal generated
- **Red flash** = SELL signal generated
- All customizable or can be disabled
---
## 📊 INTERPRETING THE INDICATOR
### **Visual Elements:**
**Main Chart Window:**
- **Thick Lime/Fuchsia Line** = MA27 angle (primary signal line)
- **Medium Green/Red Line** = MA83 angle (trend confirmation)
- **Thin Green/Red Line** = MA278 angle (slow trend filter)
- **Aqua/Orange Line** = JMA Fast (momentum detector)
- **Green/Red Area** = JMA slope (overall trend context)
- **Blue/Purple Histogram** = Momentum (angle acceleration/deceleration)
**Signal Arrows:**
- **Large Green ▲ "BUY"** = Primary buy signal (all conditions met)
- **Small Green ▲ "BUY+"** = Strong momentum buy (JMA fast cross)
- **Large Red ▼ "SELL"** = Primary sell signal (all conditions met)
- **Small Red ▼ "SELL+"** = Strong momentum sell (JMA fast cross)
**Status Table (Top Right):**
- **Angle:** Current MA27 angle in degrees
- **Trend:** Classification (STRONG UP/DOWN, UP/DOWN, FLAT)
- **Momentum:** Acceleration state (ACCEL UP/DN, Up/Down)
- **MAs:** Alignment status (ALL UP/DOWN, Mixed)
- **Zone:** Trading zone status (ACTIVE vs. NO TRADE)
- **Last:** Bars since last signal
### **Trading Strategies:**
**Strategy 1: Pure Signal Following**
- Enter LONG on BUY signal
- Exit on SELL signal
- Use stop-loss at recent swing low/high
- Works best on trending instruments
**Strategy 2: Confirmation with Price Action**
- Wait for BUY signal + bullish candlestick pattern
- Wait for SELL signal + bearish candlestick pattern
- Increases win rate by filtering premature signals
- Recommended for beginners
**Strategy 3: Momentum Acceleration**
- Use BUY+/SELL+ signals for adding to positions
- Only take these in direction of primary signal
- Scalp quick moves during momentum spikes
- For experienced traders
**Strategy 4: Mean Reversion in No-Trade Zones**
- When status shows "NO TRADE", fade extremes
- Wait for angle to exit no-trade zone for reversal
- Contrarian approach for range-bound markets
- Requires tight stops
---
## ⚠️ LIMITATIONS & DISCLAIMERS
**What This Indicator DOES:**
✅ Measures momentum direction and strength via angle analysis
✅ Generates signals when multiple conditions align
✅ Filters out low-conviction sideways markets
✅ Provides visual clarity on trend state
**What This Indicator DOES NOT:**
❌ Predict future price movements with certainty
❌ Guarantee profitable trades (no indicator can)
❌ Work equally well on all instruments/timeframes
❌ Replace proper risk management and position sizing
**Known Limitations:**
- **Lagging Nature:** Like all moving averages, signals occur after momentum begins
- **Whipsaw Risk:** Can generate false signals in volatile, directionless markets
- **Optimization Required:** Parameters need adjustment for different assets
- **Not a Complete System:** Should be combined with risk management, position sizing, and other analysis
**Best Performance Conditions:**
- Strong trending markets (crypto bull runs, stock breakouts)
- Liquid instruments (major forex pairs, large-cap stocks)
- Appropriate timeframe selection (match to trading style)
- Used alongside support/resistance and volume analysis
---
## 🔔 ALERT SETUP
The indicator includes four alert conditions:
**1. BUY SIGNAL**
- Message: "MA SMART Angle: BUY SIGNAL! Angle crossed up with momentum"
- Use for: Primary long entries
**2. SELL SIGNAL**
- Message: "MA SMART Angle: SELL SIGNAL! Angle crossed down with momentum"
- Use for: Primary short entries or long exits
**3. Strong BUY**
- Message: "MA SMART Angle: Strong BUY momentum - JMA fast crossed up"
- Use for: Adding to longs or aggressive entries
**4. Strong SELL**
- Message: "MA SMART Angle: Strong SELL momentum - JMA fast crossed down"
- Use for: Adding to shorts or aggressive exits
**Setting Up Alerts:**
1. Right-click indicator → "Add Alert on MA SMART Angle"
2. Select desired condition from dropdown
3. Choose notification method (popup, email, webhook)
4. Set alert expiration (typically "Once Per Bar Close")
---
## 📚 EDUCATIONAL VALUE
This indicator serves as an excellent learning tool for understanding:
**1. Angle-Based Momentum Analysis**
- Traditional indicators show MA crossovers
- This shows the *rate of change* (velocity) of MAs
- Teaches traders to think in terms of momentum acceleration
**2. Multi-Timeframe Confirmation**
- Shows how fast, medium, and slow MAs interact
- Demonstrates importance of trend alignment
- Helps develop patience for high-probability setups
**3. Signal Quality vs. Quantity Tradeoff**
- Simple mode = more signals, more noise
- Strict mode = fewer signals, higher quality
- Teaches discretionary filtering skills
**4. Market State Recognition**
- Visual distinction between trending and ranging markets
- Helps traders avoid trading choppy conditions
- Develops "market context" awareness
---
## 🔄 DIFFERENCES FROM OTHER MA INDICATORS
**vs. Traditional MA Crossovers:**
- Measures momentum (angle) rather than just price crossing MA
- Provides earlier signals as angles change before price crosses
- Filters better for sideways markets using no-trade zones
**vs. MACD:**
- Uses multiple MAs instead of just two
- ATR normalization makes it universal across instruments
- Visual angle representation more intuitive than histogram
**vs. Supertrend:**
- Not based on ATR bands but on MA slope analysis
- Provides graduated strength indication (not just binary trend)
- Less prone to whipsaw in low volatility
**vs. Original "MA Angles" by JD:**
- Adds explicit entry/exit signals (original had none)
- Implements no-repaint logic for reliability
- Includes signal filtering and quality controls
- Provides dual signal systems (Simple/Strict)
- Enhanced visualization and status monitoring
- Uses faster MA periods (3/8/13 vs 27/83/278) for modern markets
---
## 📖 CODE STRUCTURE (for Pine Script learners)
This indicator demonstrates:
**Advanced Pine Script Techniques:**
- Custom function implementation (JMA, angle calculation)
- Var declarations for stateful tracking
- Table creation for HUD display
- Multi-condition signal logic
- Alert system integration
- Proper use of historical references for no-repaint
**Code Organization:**
- Modular function definitions (JMA, angle)
- Clear separation of concerns (inputs, calculations, plotting, alerts)
- Extensive commenting for maintainability
- Best practices for Pine Script v5
**Learning Resources:**
- Study the JMA function to understand adaptive smoothing
- Examine angle calculation for ATR normalization technique
- Review signal logic for multi-condition confirmation patterns
- Analyze anti-spam filtering for state management
The code is open-source - feel free to study, modify, and improve upon it!
---
## 🙏 CREDITS & ATTRIBUTION
**Original Concepts:**
- **"ma angles - JD" by JD (Duyck)** - Core angle calculation methodology and indicator concept
Original open-source indicator on TradingView Community Scripts
- **JMA (Jurik Moving Average) implementation by Everget** - Smooth, low-lag moving average function
Acknowledged in original JD indicator code
- **Angle Calculation formula by KyJ** - Mathematical formula for converting MA slope to degrees using ATR normalization
Acknowledged in original JD indicator code comments
**Enhancements in This Version:**
- Signal generation logic - Original implementation for this indicator
- No-repaint confirmation system - Original implementation
- Dual signal modes (Simple/Strict) - Original implementation
- Visual enhancements and status table - Original implementation
- Alert system and signal filtering - Original implementation
- Modified MA periods (3/8/13 instead of 27/83/278) - Optimization for modern markets
**Open Source Philosophy:**
This indicator follows the open-source spirit of TradingView and the Pine Script community. The original "ma angles - JD" by JD (Duyck) was published as open-source, enabling this enhanced version. Similarly, this code is published as open-source to allow further community improvements.
---
## ⚡ QUICK START GUIDE
**For New Users:**
1. Add indicator to chart
2. Start with default settings (Simple mode)
3. Wait for BUY signal (green arrow)
4. Observe how price behaves after signal
5. Check status table to understand market state
6. Adjust parameters based on your instrument/timeframe
**For Experienced Traders:**
1. Switch to Strict mode for higher quality signals
2. Increase cooldown bars to reduce frequency
3. Raise minimum angle threshold for stronger trends
4. Combine with your existing strategy for confirmation
5. Set up alerts for desired signal types
6. Backtest on your preferred instruments
---
## 🎓 RECOMMENDED COMBINATIONS
**Works Well With:**
- **Volume Analysis:** Confirm signals with volume spikes
- **Support/Resistance:** Take signals near key levels
- **RSI/Stochastic:** Avoid overbought/oversold extremes
- **ATR:** Size positions based on volatility
- **Price Action:** Wait for candlestick confirmation
**Complementary Indicators:**
- Order Flow / Footprint (for institutional confirmation)
- Volume Profile (for identifying value areas)
- VWAP (for intraday mean reversion reference)
- Fibonacci Retracements (for target setting)
---
## 📈 PERFORMANCE EXPECTATIONS
**Realistic Win Rates:**
- Simple Mode: 45-55% (higher frequency, moderate accuracy)
- Strict Mode: 55-65% (lower frequency, higher accuracy)
- Combined with price action: 60-70%
**Best Asset Classes:**
1. **Cryptocurrencies** (strong trends, clear signals)
2. **Forex Major Pairs** (smooth price action, good angles)
3. **Large-Cap Stocks** (trending behavior, liquid)
4. **Index Futures** (trending instruments)
**Challenging Conditions:**
- Low volatility consolidation periods
- News-driven erratic movements
- Thin/illiquid instruments
- Counter-trending markets
---
## 🛡️ RISK DISCLAIMER
**IMPORTANT LEGAL NOTICE:**
This indicator is for **educational and informational purposes only**. It is **NOT financial advice** and does not constitute a recommendation to buy or sell any financial instrument.
**Trading Risks:**
- Trading carries substantial risk of loss
- Past performance does not guarantee future results
- No indicator can predict market movements with certainty
- You can lose more than your initial investment (especially with leverage)
**User Responsibilities:**
- Conduct your own research and due diligence
- Understand the instruments you trade
- Never risk more than you can afford to lose
- Use proper position sizing and risk management
- Consider consulting a licensed financial advisor
**Indicator Limitations:**
- Signals are based on historical data only
- No guarantee of accuracy or profitability
- Parameters must be optimized for your specific use case
- Results vary significantly by market conditions
By using this indicator, you acknowledge and accept all trading risks. The author is not responsible for any financial losses incurred through use of this indicator.
---
## 📧 SUPPORT & FEEDBACK
**Found a bug?** Please report it in the comments with:
- Chart symbol and timeframe
- Parameter settings used
- Description of unexpected behavior
- Screenshot if possible
**Have suggestions?** Share your ideas for improvements!
**Enjoying the indicator?** Leave a like and follow for updates!

RSI Full Forecast [Titans_Invest]RSI Full Forecast
Get ready to experience the ultimate evolution of RSI-based indicators – the RSI Full Forecast, a boosted and even smarter version of the already powerful: RSI Forecast
Now featuring over 40 additional entry conditions (forecasts), this indicator redefines the way you view the market.
AI-Powered RSI Forecasting:
Using advanced linear regression with the least squares method – a solid foundation for machine learning - the RSI Full Forecast enables you to predict future RSI behavior with impressive accuracy.
But that’s not all: this new version also lets you monitor future crossovers between the RSI and the MA RSI, delivering early and strategic signals that go far beyond traditional analysis.
You’ll be able to monitor future crossovers up to 20 bars ahead, giving you an even broader and more precise view of market movements.
See the Future, Now:
• Track upcoming RSI & RSI MA crossovers in advance.
• Identify potential reversal zones before price reacts.
• Uncover statistical behavior patterns that would normally go unnoticed.
40+ Intelligent Conditions:
The new layer of conditions is designed to detect multiple high-probability scenarios based on historical patterns and predictive modeling. Each additional forecast is a window into the price's future, powered by robust mathematics and advanced algorithmic logic.
Full Customization:
All parameters can be tailored to fit your strategy – from smoothing periods to prediction sensitivity. You have complete control to turn raw data into smart decisions.
Innovative, Accurate, Unique:
This isn’t just an upgrade. It’s a quantum leap in technical analysis.
RSI Full Forecast is the first of its kind: an indicator that blends statistical analysis, machine learning, and visual design to create a true real-time predictive system.
⯁ SCIENTIFIC BASIS LINEAR REGRESSION
Linear Regression is a fundamental method of statistics and machine learning, used to model the relationship between a dependent variable y and one or more independent variables 𝑥.
The general formula for a simple linear regression is given by:
y = β₀ + β₁x + ε
β₁ = Σ((xᵢ - x̄)(yᵢ - ȳ)) / Σ((xᵢ - x̄)²)
β₀ = ȳ - β₁x̄
Where:
y = is the predicted variable (e.g. future value of RSI)
x = is the explanatory variable (e.g. time or bar index)
β0 = is the intercept (value of 𝑦 when 𝑥 = 0)
𝛽1 = is the slope of the line (rate of change)
ε = is the random error term
The goal is to estimate the coefficients 𝛽0 and 𝛽1 so as to minimize the sum of the squared errors — the so-called Random Error Method Least Squares.
⯁ LEAST SQUARES ESTIMATION
To minimize the error between predicted and observed values, we use the following formulas:
β₁ = /
β₀ = ȳ - β₁x̄
Where:
∑ = sum
x̄ = mean of x
ȳ = mean of y
x_i, y_i = individual values of the variables.
Where:
x_i and y_i are the means of the independent and dependent variables, respectively.
i ranges from 1 to n, the number of observations.
These equations guarantee the best linear unbiased estimator, according to the Gauss-Markov theorem, assuming homoscedasticity and linearity.
⯁ LINEAR REGRESSION IN MACHINE LEARNING
Linear regression is one of the cornerstones of supervised learning. Its simplicity and ability to generate accurate quantitative predictions make it essential in AI systems, predictive algorithms, time series analysis, and automated trading strategies.
By applying this model to the RSI, you are literally putting artificial intelligence at the heart of a classic indicator, bringing a new dimension to technical analysis.
⯁ VISUAL INTERPRETATION
Imagine an RSI time series like this:
Time →
RSI →
The regression line will smooth these values and extend them n periods into the future, creating a predicted trajectory based on the historical moment. This line becomes the predicted RSI, which can be crossed with the actual RSI to generate more intelligent signals.
⯁ SUMMARY OF SCIENTIFIC CONCEPTS USED
Linear Regression Models the relationship between variables using a straight line.
Least Squares Minimizes the sum of squared errors between prediction and reality.
Time Series Forecasting Estimates future values based on historical data.
Supervised Learning Trains models to predict outputs from known inputs.
Statistical Smoothing Reduces noise and reveals underlying trends.
⯁ WHY THIS INDICATOR IS REVOLUTIONARY
Scientifically-based: Based on statistical theory and mathematical inference.
Unprecedented: First public RSI with least squares predictive modeling.
Intelligent: Built with machine learning logic.
Practical: Generates forward-thinking signals.
Customizable: Flexible for any trading strategy.
⯁ CONCLUSION
By combining RSI with linear regression, this indicator allows a trader to predict market momentum, not just follow it.
RSI Full Forecast is not just an indicator — it is a scientific breakthrough in technical analysis technology.
⯁ Example of simple linear regression, which has one independent variable:
⯁ In linear regression, observations ( red ) are considered to be the result of random deviations ( green ) from an underlying relationship ( blue ) between a dependent variable ( y ) and an independent variable ( x ).
⯁ Visualizing heteroscedasticity in a scatterplot against 100 random fitted values using Matlab:
⯁ The data sets in the Anscombe's quartet are designed to have approximately the same linear regression line (as well as nearly identical means, standard deviations, and correlations) but are graphically very different. This illustrates the pitfalls of relying solely on a fitted model to understand the relationship between variables.
⯁ The result of fitting a set of data points with a quadratic function:
_________________________________________________
🔮 Linear Regression: PineScript Technical Parameters 🔮
_________________________________________________
Forecast Types:
• Flat: Assumes prices will remain the same.
• Linreg: Makes a 'Linear Regression' forecast for n periods.
Technical Information:
ta.linreg (built-in function)
Linear regression curve. A line that best fits the specified prices over a user-defined time period. It is calculated using the least squares method. The result of this function is calculated using the formula: linreg = intercept + slope * (length - 1 - offset), where intercept and slope are the values calculated using the least squares method on the source series.
Syntax:
• Function: ta.linreg()
Parameters:
• source: Source price series.
• length: Number of bars (period).
• offset: Offset.
• return: Linear regression curve.
This function has been cleverly applied to the RSI, making it capable of projecting future values based on past statistical trends.
______________________________________________________
______________________________________________________
⯁ WHAT IS THE RSI❓
The Relative Strength Index (RSI) is a technical analysis indicator developed by J. Welles Wilder. It measures the magnitude of recent price movements to evaluate overbought or oversold conditions in a market. The RSI is an oscillator that ranges from 0 to 100 and is commonly used to identify potential reversal points, as well as the strength of a trend.
⯁ HOW TO USE THE RSI❓
The RSI is calculated based on average gains and losses over a specified period (usually 14 periods). It is plotted on a scale from 0 to 100 and includes three main zones:
• Overbought: When the RSI is above 70, indicating that the asset may be overbought.
• Oversold: When the RSI is below 30, indicating that the asset may be oversold.
• Neutral Zone: Between 30 and 70, where there is no clear signal of overbought or oversold conditions.
______________________________________________________
______________________________________________________
⯁ ENTRY CONDITIONS
The conditions below are fully flexible and allow for complete customization of the signal.
______________________________________________________
______________________________________________________
🔹 CONDITIONS TO BUY 📈
______________________________________________________
• Signal Validity: The signal will remain valid for X bars .
• Signal Sequence: Configurable as AND or OR .
📈 RSI Conditions:
🔹 RSI > Upper
🔹 RSI < Upper
🔹 RSI > Lower
🔹 RSI < Lower
🔹 RSI > Middle
🔹 RSI < Middle
🔹 RSI > MA
🔹 RSI < MA
📈 MA Conditions:
🔹 MA > Upper
🔹 MA < Upper
🔹 MA > Lower
🔹 MA < Lower
📈 Crossovers:
🔹 RSI (Crossover) Upper
🔹 RSI (Crossunder) Upper
🔹 RSI (Crossover) Lower
🔹 RSI (Crossunder) Lower
🔹 RSI (Crossover) Middle
🔹 RSI (Crossunder) Middle
🔹 RSI (Crossover) MA
🔹 RSI (Crossunder) MA
🔹 MA (Crossover) Upper
🔹 MA (Crossunder) Upper
🔹 MA (Crossover) Lower
🔹 MA (Crossunder) Lower
📈 RSI Divergences:
🔹 RSI Divergence Bull
🔹 RSI Divergence Bear
📈 RSI Forecast:
🔹 RSI (Crossover) MA Forecast
🔹 RSI (Crossunder) MA Forecast
🔹 RSI Forecast 1 > MA Forecast 1
🔹 RSI Forecast 1 < MA Forecast 1
🔹 RSI Forecast 2 > MA Forecast 2
🔹 RSI Forecast 2 < MA Forecast 2
🔹 RSI Forecast 3 > MA Forecast 3
🔹 RSI Forecast 3 < MA Forecast 3
🔹 RSI Forecast 4 > MA Forecast 4
🔹 RSI Forecast 4 < MA Forecast 4
🔹 RSI Forecast 5 > MA Forecast 5
🔹 RSI Forecast 5 < MA Forecast 5
🔹 RSI Forecast 6 > MA Forecast 6
🔹 RSI Forecast 6 < MA Forecast 6
🔹 RSI Forecast 7 > MA Forecast 7
🔹 RSI Forecast 7 < MA Forecast 7
🔹 RSI Forecast 8 > MA Forecast 8
🔹 RSI Forecast 8 < MA Forecast 8
🔹 RSI Forecast 9 > MA Forecast 9
🔹 RSI Forecast 9 < MA Forecast 9
🔹 RSI Forecast 10 > MA Forecast 10
🔹 RSI Forecast 10 < MA Forecast 10
🔹 RSI Forecast 11 > MA Forecast 11
🔹 RSI Forecast 11 < MA Forecast 11
🔹 RSI Forecast 12 > MA Forecast 12
🔹 RSI Forecast 12 < MA Forecast 12
🔹 RSI Forecast 13 > MA Forecast 13
🔹 RSI Forecast 13 < MA Forecast 13
🔹 RSI Forecast 14 > MA Forecast 14
🔹 RSI Forecast 14 < MA Forecast 14
🔹 RSI Forecast 15 > MA Forecast 15
🔹 RSI Forecast 15 < MA Forecast 15
🔹 RSI Forecast 16 > MA Forecast 16
🔹 RSI Forecast 16 < MA Forecast 16
🔹 RSI Forecast 17 > MA Forecast 17
🔹 RSI Forecast 17 < MA Forecast 17
🔹 RSI Forecast 18 > MA Forecast 18
🔹 RSI Forecast 18 < MA Forecast 18
🔹 RSI Forecast 19 > MA Forecast 19
🔹 RSI Forecast 19 < MA Forecast 19
🔹 RSI Forecast 20 > MA Forecast 20
🔹 RSI Forecast 20 < MA Forecast 20
______________________________________________________
______________________________________________________
🔸 CONDITIONS TO SELL 📉
______________________________________________________
• Signal Validity: The signal will remain valid for X bars .
• Signal Sequence: Configurable as AND or OR .
📉 RSI Conditions:
🔸 RSI > Upper
🔸 RSI < Upper
🔸 RSI > Lower
🔸 RSI < Lower
🔸 RSI > Middle
🔸 RSI < Middle
🔸 RSI > MA
🔸 RSI < MA
📉 MA Conditions:
🔸 MA > Upper
🔸 MA < Upper
🔸 MA > Lower
🔸 MA < Lower
📉 Crossovers:
🔸 RSI (Crossover) Upper
🔸 RSI (Crossunder) Upper
🔸 RSI (Crossover) Lower
🔸 RSI (Crossunder) Lower
🔸 RSI (Crossover) Middle
🔸 RSI (Crossunder) Middle
🔸 RSI (Crossover) MA
🔸 RSI (Crossunder) MA
🔸 MA (Crossover) Upper
🔸 MA (Crossunder) Upper
🔸 MA (Crossover) Lower
🔸 MA (Crossunder) Lower
📉 RSI Divergences:
🔸 RSI Divergence Bull
🔸 RSI Divergence Bear
📉 RSI Forecast:
🔸 RSI (Crossover) MA Forecast
🔸 RSI (Crossunder) MA Forecast
🔸 RSI Forecast 1 > MA Forecast 1
🔸 RSI Forecast 1 < MA Forecast 1
🔸 RSI Forecast 2 > MA Forecast 2
🔸 RSI Forecast 2 < MA Forecast 2
🔸 RSI Forecast 3 > MA Forecast 3
🔸 RSI Forecast 3 < MA Forecast 3
🔸 RSI Forecast 4 > MA Forecast 4
🔸 RSI Forecast 4 < MA Forecast 4
🔸 RSI Forecast 5 > MA Forecast 5
🔸 RSI Forecast 5 < MA Forecast 5
🔸 RSI Forecast 6 > MA Forecast 6
🔸 RSI Forecast 6 < MA Forecast 6
🔸 RSI Forecast 7 > MA Forecast 7
🔸 RSI Forecast 7 < MA Forecast 7
🔸 RSI Forecast 8 > MA Forecast 8
🔸 RSI Forecast 8 < MA Forecast 8
🔸 RSI Forecast 9 > MA Forecast 9
🔸 RSI Forecast 9 < MA Forecast 9
🔸 RSI Forecast 10 > MA Forecast 10
🔸 RSI Forecast 10 < MA Forecast 10
🔸 RSI Forecast 11 > MA Forecast 11
🔸 RSI Forecast 11 < MA Forecast 11
🔸 RSI Forecast 12 > MA Forecast 12
🔸 RSI Forecast 12 < MA Forecast 12
🔸 RSI Forecast 13 > MA Forecast 13
🔸 RSI Forecast 13 < MA Forecast 13
🔸 RSI Forecast 14 > MA Forecast 14
🔸 RSI Forecast 14 < MA Forecast 14
🔸 RSI Forecast 15 > MA Forecast 15
🔸 RSI Forecast 15 < MA Forecast 15
🔸 RSI Forecast 16 > MA Forecast 16
🔸 RSI Forecast 16 < MA Forecast 16
🔸 RSI Forecast 17 > MA Forecast 17
🔸 RSI Forecast 17 < MA Forecast 17
🔸 RSI Forecast 18 > MA Forecast 18
🔸 RSI Forecast 18 < MA Forecast 18
🔸 RSI Forecast 19 > MA Forecast 19
🔸 RSI Forecast 19 < MA Forecast 19
🔸 RSI Forecast 20 > MA Forecast 20
🔸 RSI Forecast 20 < MA Forecast 20
______________________________________________________
______________________________________________________
🤖 AUTOMATION 🤖
• You can automate the BUY and SELL signals of this indicator.
______________________________________________________
______________________________________________________
⯁ UNIQUE FEATURES
______________________________________________________
Linear Regression: (Forecast)
Signal Validity: The signal will remain valid for X bars
Signal Sequence: Configurable as AND/OR
Condition Table: BUY/SELL
Condition Labels: BUY/SELL
Plot Labels in the Graph Above: BUY/SELL
Automate and Monitor Signals/Alerts: BUY/SELL
Linear Regression (Forecast)
Signal Validity: The signal will remain valid for X bars
Signal Sequence: Configurable as AND/OR
Condition Table: BUY/SELL
Condition Labels: BUY/SELL
Plot Labels in the Graph Above: BUY/SELL
Automate and Monitor Signals/Alerts: BUY/SELL
______________________________________________________
📜 SCRIPT : RSI Full Forecast
🎴 Art by : @Titans_Invest & @DiFlip
👨💻 Dev by : @Titans_Invest & @DiFlip
🎑 Titans Invest — The Wizards Without Gloves 🧤
✨ Enjoy!
______________________________________________________
o Mission 🗺
• Inspire Traders to manifest Magic in the Market.
o Vision 𐓏
• To elevate collective Energy 𐓷𐓏

Easy MA SignalsEasy MA Signals
Overview
Easy MA Signals is a versatile Pine Script indicator designed to help traders visualize moving average (MA) trends, generate buy/sell signals based on crossovers or custom price levels, and enhance chart analysis with volume-based candlestick coloring. Built with flexibility in mind, it supports multiple MA types, crossover options, and customizable signal appearances, making it suitable for traders of all levels. Whether you're a day trader, swing trader, or long-term investor, this indicator provides actionable insights while keeping your charts clean and intuitive.
Configure the Settings
The indicator is divided into three input groups for ease of use:
General Settings:
Candlestick Color Scheme: Choose from 10 volume-based color schemes (e.g., Sapphire Pulse, Emerald Spark) to highlight high/low volume candles. Select “None” for TradingView’s default colors.
Moving Average Length: Set the MA period (default: 20). Adjust for faster (lower values) or slower (higher values) signals.
Moving Average Type: Choose between SMA, EMA, or WMA (default: EMA).
Show Buy/Sell Signals: Enable/disable signal plotting (default: enabled).
Moving Average Crossover: Select a crossover type (e.g., MA vs VWAP, MA vs SMA50) for signals or “None” to disable.
Volume Influence: Adjust how volume impacts candlestick colors (default: 1.2). Higher values make thresholds stricter.
Signal Appearance Settings:
Buy/Sell Signal Shape: Choose shapes like triangles, arrows, or labels for signals.
Buy/Sell Signal Position: Place signals above or below bars.
Buy/Sell Signal Color: Customize colors for better visibility (default: green for buy, red for sell).
Custom Price Alerts:
Custom Buy/Sell Alert Price: Set specific price levels for alerts (default: 0, disabled). Enter a non-zero value to enable.
Set Up Alerts
To receive notifications (e.g., sound, popup, email) when signals or custom price levels are hit:
Click the Alert button (alarm clock icon) in TradingView.
Select Easy MA Signals as the condition and choose one of the four alert types:
MA Crossover Buy Alert: Triggers on MA crossover buy signals.
MA Crossover Sell Alert: Triggers on MA crossover sell signals.
Custom Buy Alert: Triggers when price crosses above the custom buy price.
Custom Sell Alert: Triggers when price crosses below the custom sell price.
Enable Play Sound and select a sound (e.g., “Bell”).
Set the frequency (e.g., Once Per Bar Close for confirmed signals) and create the alert.
Analyze the Chart
Moving Average Line: Displays the selected MA with color changes (green for bullish, red for bearish, gray for neutral) based on price position relative to the MA.
Buy/Sell Signals: Appear as shapes or labels when crossovers or custom price levels are hit.
Candlestick Colors: If a color scheme is selected, candles change color based on volume strength (high, low, or neutral), aiding in trend confirmation.
Why Use Easy MA Signals?
Easy MA Signals is designed to simplify technical analysis while offering advanced customization. It’s ideal for traders who want:
A clear visualization of MA trends and crossovers.
Flexible signal generation based on MA crossovers or custom price levels.
Volume-enhanced candlestick coloring to identify market strength.
Easy-to-use settings with tooltips for beginners and pros alike.
This script is particularly valuable because it combines multiple features into one indicator, reducing chart clutter and providing actionable insights without overwhelming the user.
Benefits of Easy MA Signals
Highly Customizable: Supports SMA, EMA, and WMA with adjustable lengths.
Offers multiple crossover options (VWAP, SMA10, SMA20, etc.) for tailored strategies.
Custom price alerts allow precise targeting of key levels.
Volume-Based Candlestick Coloring: 10 unique color schemes highlight volume strength, helping traders confirm trends.
Adjustable volume influence ensures adaptability to different markets.
Flexible Signal Visualization: Choose from various signal shapes (triangles, arrows, labels) and positions (above/below bars).
Customizable colors improve visibility on any chart background.
Alert Integration: Built-in alert conditions for crossovers and custom prices support sound, email, and app notifications.
Easy setup for real-time trading decisions.
User-Friendly Design: Organized input groups with clear tooltips make configuration intuitive.
Suitable for beginners and advanced traders alike.
Example Use Cases
Swing Trading with MA Crossovers:
Scenario: A trader wants to trade Bitcoin (BTC/USD) on a 4-hour chart using an EMA crossover strategy.
Setup:
Set Moving Average Type to EMA, Length to 20.
Set Moving Average Crossover to “MA vs SMA50”.
Enable Show Buy/Sell Signals and choose “arrowup” for buy, “arrowdown” for sell.
Select “Emerald Spark” for candlestick colors to highlight volume surges.
Usage: Buy when the EMA20 crosses above the SMA50 (green arrow appears) and volume is high (dark green candles). Sell when the EMA20 crosses below the SMA50 (red arrow). Set alerts for real-time notifications.
Scalping with Custom Price Alerts:
Scenario: A day trader monitors Tesla (TSLA) on a 5-minute chart and wants alerts at specific support/resistance levels.
Setup:
Set Custom Buy Alert Price to 150.00 (support) and Custom Sell Alert Price to 160.00 (resistance).
Use “labelup” for buy signals and “labeldown” for sell signals.
Keep Moving Average Crossover as “None” to focus on price alerts.
Usage: Receive a sound alert and label when TSLA crosses 150.00 (buy) or 160.00 (sell). Use volume-colored candles to confirm momentum before entering trades.
When NOT to Use Easy MA Signals
High-Frequency Trading: Reason: The indicator relies on moving averages and volume, which may lag in ultra-fast markets (e.g., sub-second trades). High-frequency traders may need specialized tools with real-time tick data.
Alternative: Use order book or market depth indicators for faster execution.
Low-Volatility or Sideways Markets:
Reason: MA crossovers and custom price alerts can generate false signals in choppy, range-bound markets, leading to whipsaws.
Alternative: Use oscillators like RSI or Bollinger Bands to trade within ranges.
This indicator is tailored more towards less experienced traders. And as always, paper trade until you are comfortable with how this works if you're unfamiliar with trading! We hope you enjoy this and have great success. Thanks for your interested in Easy MA Signals!
